Table Of Contents
Excel Z Test Function
Excel Z TEST is a kind of hypothesis test used to test the alternative hypothesis against the null hypothesis. The null hypothesis is a hypothesis that refers to a common statement in general. By conducting a hypothesis test, we can try to prove that the null hypothesis is false against the alternative hypothesis.
For example, suppose we have the data(6,7,8,9,5,4,10,4) from A7:A14. Then, to calculate the one-tailed probability value of a Z.TEST for the data with a hypothesized population mean of 4, we will use the following formula:
=Z.TEST(A7:A14,4)
= 0.00052.
The Z.TEST function is one such hypothesis test function. It tests the mean of the two sample data sets when the variance is known and the sample size is large. The sample size should be >= 30. Otherwise, we need to use T-TEST. To Z.TEST, we need to have two independent data points that are not related to each other or do not affect each other data points. We should normally distributed the data.
Syntax
The Z.TEST is the built-in function in Excel. Below is the formula of the Z.TEST function in Excel.

- array: This is the range of cells that contains data points against which we need to test x. The value of cells against the hypothesis sample mean is to be tested.
- x: From the array, the x value is to be tested.
- sigma: This is the overall population's standard deviation. It is an optional argument. If this is omitted, then Excel uses the sample standard deviation.
How to Perform the Z Test in Excel? (with Examples)
Example #1 - Using the Z.Test Formula
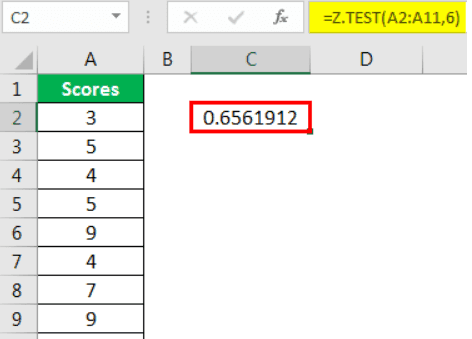
Look at the below data.

We will use this data to calculate the one-tailed probability value of Z.TEST. For this, assume the hypothesis population means 6.
The steps to use the Z.Test formula in Excel are as follows:
- So, open the Z.TEST formula in an Excel cell.

- Select the array as scores, A2 to A11.

- The next argument is "x." Since we have already assumed the hypothesized population mean is 6, apply this value to this argument.

- The last argument is optional, so close the formula to get the Z.TEST value.

- It is a one-tailed Z TEST value to get the two-tailed Z.TEST value to multiply this value by 2.

Example #2 - Z TEST Using Data Analysis Option
We can conduct Z.TEST using the "Data Analysis" option in Excel. To compare two means when the variance is known, we use Z.TEST. We can frame two hypotheses here. One is the "Null Hypothesis." Another one is the "Alternative Hypothesis" below is the equation of both these hypotheses.
H0: μ1 – μ2 = 0 (Null Hypothesis)
H1: μ1 – μ2 ≠ 0 (Alternative Hypothesis)
The alternative hypothesis (H1) states that the two population means are not equal.
We will use two students' scores in multiple subjects for this example.

- Step 1: First, we need to calculate the variables for these two values using the VAR.P function.

- Step 2: Go to the "Data" tab and click "Data Analysis."

Scroll down and select z-Test: Two Sample for Means" and click on "OK."

- Step 3: For the "Variable 1 Range," select "Student 1" scores. For the "Variable 2 Range," select "Student 2" scores.

- Step 4: For "Variable 1 Variance(known)," select "Student 1" variance score, and for "Variable 2 Variance(known)," select "Student 2" variance score.

- Step 5: Select the "Output Range" as a cell and press "OK."

We got the result.

We can reject the null hypothesis if Z < – Z Critical Two-Tailed Z > Z Critical Two Tail.
So, from the Z.TEST result, below are the results.
- Z < - Z Critical Two Tail = -1.080775083 > - 1.959963985
- Z > Z Critical Two Tail = -1.080775083 < 1.959963985
Since it meets our criteria, we cannot reject the null hypothesis. So, the means of the two students do not differ significantly.
Things to Remember
- All the arguments should be numerical values. Otherwise, we will get #VALUE! Error.
- The array value should contain numbers. Otherwise, we will get a #N/A error.
- The Z.TEST can be applied to large data sets.

