Table Of Contents
Z Test Formula Meaning
Z-Test Formula refers to the statistical expression that helps carry out the hypothesis test to determine whether the two samples’ means calculated are different in case the standard deviations are available and the sample is large.

Z test formula finds relevance when group means are required to be compared. It is a form of statistical expression where samples are drawn to derive conclusions about the populations in question. This is the reason that makes Z test also known as inferential statistics.
Key Takeaways
- Z-Test statistics refers to the hypothesis test to determine whether the two samples’ means evaluated are different if the standard deviations are accessible and the sample is large.
- It is critical to know the Z-test statistics concept as it uses typically whenever it is arguable whether or not a test statistic follows a normal distribution under the concerned null hypothesis.
- One must remember that they may use the Z-test only when the sample size exceeds 30. Else they must use the T-Test.
Z Test Formula Explained
Z-test Formula is a statistical expression that can help users and analysts find the extent to which the group means differ. As a result, the expected deviations and ranges of values are properly known. The formula can be used as one sample and two sample expression.
While one sample Z test formula is used to assess if the population mean differs from a hypothesized value, the two sample Z test formula lets users check if the mean of the two population in question differ.
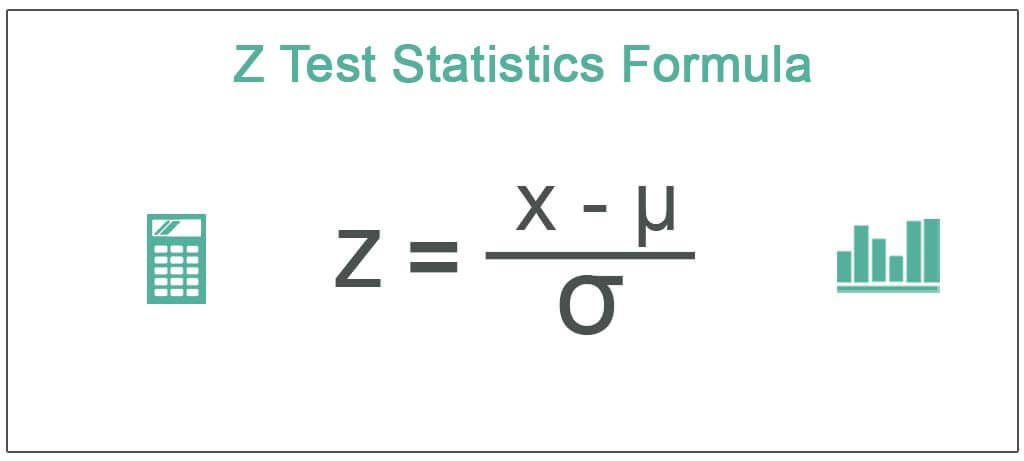
The formula below is used to determine the differences in the group means. Let us have a look at it:
where x = any value from the population
- μ = population mean
- ơ = population standard deviation
In the case of a sample, the formula for Z-test statistics of value calculates deducting the sample mean from the X-value. Then the result is divided by the sample standard deviation. Mathematically, it represents as
where
- x = any value from the sample
- x_mean = sample mean
- s = sample standard deviation
How To Calculate?
The formula for Z-test statistics for a population derives using the following steps:
- Firstly, calculate the population means and standard deviation based on the observation captured in the population mean, and each observation is denoted by xi. Then, the total number of observations in the population is denoted by N.
Population mean,
Population standard deviation,
- Finally, the Z-test statistics computes deducting the population mean from the variable. Then, the result is divided by the population standard deviation, as shown below.
Z = (x - μ) / ơ
The formula for Z-test statistics for a sample derives from the following steps: - Firstly, calculate the sample mean and standard deviation the same as above. Here, the total number of observations in the sample is denoted by n such that n < N.
Sample mean,
Sample standard deviation,
- Finally, the Z-test statistics are calculated by deducting the sample mean from the X-value. Then, the result is divided by the sample standard deviation, as shown below.
Z = (x - x_mean) / s
Examples
Let us consider the following examples to understand how Z-test formula in research works:
Example #1
Let us assume a population of students in a school who appeared for a class test. The mean score in the test is 75, and the standard deviation is 15. But, first, determine the Z-test score of David, who scored 90 on the test.
Given
- The population mean, μ= 75
- Population standard deviation, ơ = 15

Therefore, one can calculate the Z-test statistics as

Z = (90 - 75) / 15
Z Test Statistics will be -

- Z = 1
Therefore, David's test score is one standard deviation above the mean score of the population, i.e., as per the z-score table, 84.13% of students score less than David.
Example #2
Take the example of 30 students selected as a part of a sample team surveyed to see how many pencils used in a week. Determine the Z-test score for the 3rd student of based on the given responses: 3, 2, 5, 6, 4, 7, 4, 3, 3, 8, 3, 1, 3, 6, 5, 2, 4, 3, 6, 4, 5, 2, 2, 4, 4, 2, 8, 3, 6, 7.
Given,
- x = 5, since the 3rd student’s response, is 5
- Sample size, n = 30
Sample mean, = (3 + 2 + 5 + 6 + 4 + 7 + 4 + 3 + 3 + 8 + 3 + 1 + 3 + 6 + 5 + 2 + 4 + 3 + 6 + 4 + 5 + 2 + 2 + 4 + 4 + 2 + 8 + 3 + 6 + 7) / 30
Mean = 4.17
One can calculate the sample standard deviation using the above formula.
ơ = 1.90
Therefore, one calculates the Z-test score for the 3rd student as,
Z = (x – x ) / s
- Z = (5 –17) / 1.90
- Z = 0.44
Therefore, the 3rd student's usage is 0.44 times the standard deviation above the mean usage of the sample, i.e., as per the Z- score table, 67% of students use fewer pencils than the 3rd student.
Example #3
Take the example of 30 students selected as a part of a sample team surveyed to see how many pencils were used in a week. Determine the Z-test score for the 3rd student of based on the given responses: 3, 2, 5, 6, 4, 7, 4, 3, 3, 8, 3, 1, 3, 6, 5, 2, 4, 3, 6, 4, 5, 2, 2, 4, 4, 2, 8, 3, 6, 7.
Below is given data for the calculation of Z-test statistics.


You can refer to the Excel sheet below for the detailed calculation of Z-test statistics.
Relevance and Uses
It is essential to understand the concept of Z-test statistics because it usually uses whenever it is arguable whether or not a test statistic follows a normal distribution under the concerned null hypothesis. However, one should remember that one can use the Z-test only when the sample size exceeds 30. Otherwise, one may use the t-test.

