Yule's Q and Odds Ratio are two statistical measures commonly used to assess the association between binary variables. Let's explore the similarities and differences between these measures.
Table Of Contents
Yule's Q is a statistical measure used to determine the association between two or more binary or nominal variables. The prime purpose of this measure is to estimate the association between variables with a dichotomous division.
The concept originates from the works of the British statistician George Udny Yule in the early 20th century. Yule's Q coefficient is calculated based on a 2x2 contingency table, which organizes the frequencies or counts of observations for two variables with two levels or categories.
Key Takeaways
Yule's Q is a statistical measure commonly used in a 2x2 contingency table. It allows for analyzing two variables within the matrix, each having two levels or categories. These variables represent a dichotomy, such as male/female, true/false, or agree/disagree. This measure determines the association between these variables, also known as Yule's Q coefficient of association.
The primary purpose of this measure is to assess the relationship between variables with infinite values or a wide range of possibilities. When obtaining accurate results with infinite values is challenging, researchers can simplify the variables by dichotomizing them into four cells or a "magic quadrant." This quadrant consists of two rows and two columns representing the variables. The ratio of the differences between the diagonal cell sums to the total of the remaining diagonal cells is calculated as the "Yule's Q coefficient."
It is important to note that there are certain assumptions when interpreting it. The first assumption is that Yule's Q coefficient is a distribution-free statistic, meaning it does not rely on any specific data distribution. The second assumption is that the variables being analyzed must be dichotomous.
Interpreting it is straightforward with these assumptions. A negative value indicates an inverse or negative relationship between the variables, where an increase in one variable corresponds to a decrease in the other and vice versa. Conversely, a positive value indicates a direct or positive relationship. A zero value suggests no association between the variables, meaning they are independent.
With the help of the 2 x 2 contingency tables, we can determine the value of the matrix. So, let us look at the formula:
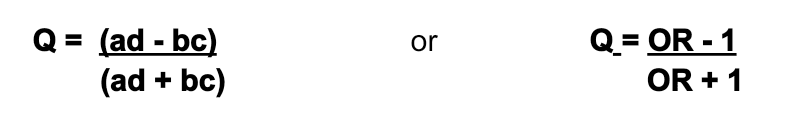
Where,
a, b, c, d are the variables present in the matrix. In other words, they act as frequencies in the cells, and OR refers to the value obtained by performing the odds ratio.
Although there are three resulting values (+1, -1, and 0), the pairing depends on the researcher's choices. However, their choice does not merely affect the final values.
Suppose a university has held elections for the college head position. They wish to know how many candidates will apply for the role. However, they still need clarification with their responses. In total, there were 200 students at the university.
Of these, 100 students belonged to the second year, and 100 were from the final year. From the second year, 40 students wished to become the head, while the rest avoided it. Likewise, 60 students applied for the role in the final year, and the rest were denied.
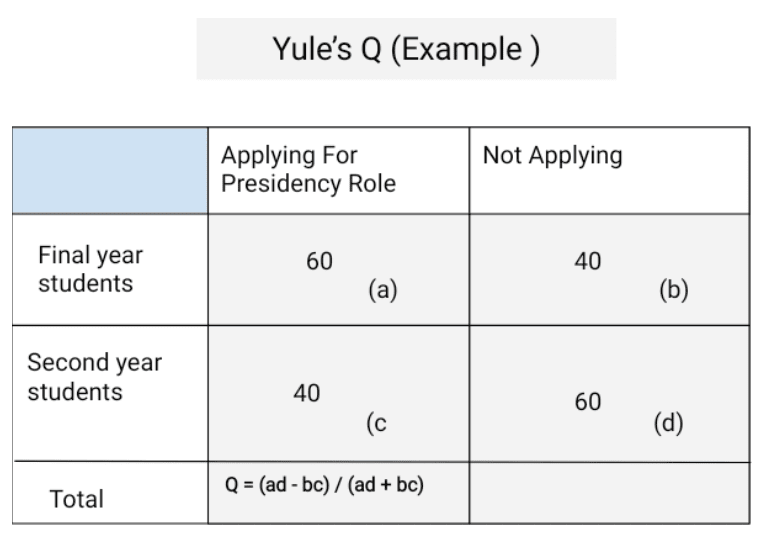
So, let us look at the schedule and calculation:
Q = (ad - bc) / (ad + bc)
= /
= (3600 - 1600) / (3600 + 1600)
= 2000/ 5200
= 0.38
Since the value is more than 0 and less than 1 (0.38) indicates a positive relationship between the variables. It also specifies the willingness of the candidates to apply for the role.
Yule's Q has some applications in the real world. Let us look at them:
It is visible in medical research to determine the relationship between medicine and its effectiveness. It tries to account for binary variables at the nominal level. For example, the Q value will state the association between medicine and a patient's recovery. So, if the new vaccine has cured patients, the value will be positive. Otherwise, it can also be used to determine the traces of a disease and its occurrence in genetics.
In sociology, the use of this measure is prevalent. Economists use it to understand the relationship between gender groups and voting percentage.
Researchers mainly use this measure in their statistical studies while studying the economy. It helps determine the association of micro and macroeconomic factors with the nation's current condition—for example, the effect of demand on inflation levels.
The marketing department can broadly apply Yule's Q calculator to determine the link between binary variables, like advertisement cost and revenue growth. A similar association between the latter and customer lifetime value (CLV) can exist.
Advantages And Disadvantages
Advantages
Disadvantages
Yule's Q and Odds Ratio are two statistical measures commonly used to assess the association between binary variables. Let's explore the similarities and differences between these measures.
| Basis | Yule's Q | Odds Ratio |
|---|---|---|
| 1. Meaning | It refers to the statistical measure for determining the relationship between binary variables. | The odds ratio tries to understand the strength or association between two variables (exposure and outcome). |
| 2. Purpose | To find the association between the variables. | To determine the odds for an event to occur. |
| 3. Formula | Q = (ad - bc) / (ad + bc) | OR = (ad) / (bc) |
