Table Of Contents
What Is Technical Analysis?
Technical analysis is the process of predicting the price movement of tradable instruments using historical trading charts and market data. As a result, investors can spot potential short- and long-term investment opportunities. Commonly used in behavioral finance and quantitative research, it helps analysts examine trends in securities trading.

Technical analysis allows traders to evaluate the impact of a security's supply and demand on its price, volume, and volatility. Trading signals and price patterns obtained through this metric accurately reflect current stock, forex, and commodities markets conditions. On the other hand, the fundamental analysis only evaluates the company's financials (sales and earnings).
Table of contents
- What Is Technical Analysis?
- Technical analysis meaning refers to the method of anticipating the price movement of tradable instruments using past price actions, trade charts, and market data.
- It allows traders to assess the impact of supply and demand on a security's price, volume, and volatility, discover short- and long-term investment opportunities, and choose when to enter or quit the market.
- It differs from fundamental analysis, which forecasts market situations based on a review of a company's financial statements (sales and earnings).
- The most frequent means of displaying technical analysis results are candlesticks, bars, and line charts.
Technical Analysis Explained
Technical analysis of stocks or forex enables investors to estimate the price direction of an asset based on historical data, such as price and trading volume. The forecasts allow traders to understand market sentiments and decide where to invest for profits. When used in conjunction with fundamental analysis, it is likely to provide the best return on investment.
As the buying and selling actions in the market reflect all the required information related to the security in question, assigning a fair or true market value to the security becomes a continuous affair. This value is what technical analysis assures and helps trace from time to time to make relevant future price predictions.
Fundamental analysis is the means of forecasting market scenarios based on the financial statements of businesses to evaluate the fair value of assets. This value is subject to external factors and intrinsic parameters. On the other hand, the technical analysis considers historical prices to predict future prices.
Most traders follow fundamental analysis to decide whether to invest in an asset. And they then use technical analysis to assess risks associated with the investment while identifying low-risk entry prices for buying securities.
As we dive into the complexities of this topic, it becomes clear how foundational knowledge can lead to practical applications. Those interested in enhancing their skills further might find this Basic & Advanced Technical Analysis Bundle Course helpful for gaining deeper insights.
Explained in Video: Fundamental Analysis vs. Technical Analysis
Technical Analysis Features
- Technical analysis assumes three scenarios: the market discounts everything, which means that prices reflect all relevant information about an asset, prices follow trends or exhibit countertrends, and historical price movements repeat themselves.
- It is conducted keeping into account the time frames and technical indicators that traders use.
- Based on technical analysis, charts are prepared at regular intervals, for example, in 5-minute, 15-minute, hourly, 4-hour, and daily.
Types Of Technical Analysis Charts
Technical analysis examines past price charts and patterns (that may be repeatable) for security and forecasts future price trends. Investors can rely on it and invest per their knowledge. It can be used to depict and predict price patterns of any asset, be it stocks, futures, bonds, fixed-income securities, commodities, or currency pairs.

Investors analyze price movements to get an idea of the market direction and represent them on a graph in various forms. Then, traders examine trades based on them and decide whether to invest or wait for a better trading opportunity.
As an investor, one might find the price movements being represented in the following forms:
#1 - Candlestick
The candlesticks help investors identify trading patterns and enter a profitable trade. The patterns are represented by combining two or more candles in a particular sequence. This representation could be better and more useful with a single candlestick than multiple for an overall market view. With the help of these patterns, traders can:
- Buy stronger positions and sell weaker ones – The strength is represented by a bullish candle (normally in blue), and weakness is indicated via a red candlestick (normally in red).
- Be flexible with patterns – The technical analysis reports tell investors how a real trading pattern differs from those studied in textbooks. Thus, it teaches them to be flexible with trading patterns depicted using candlesticks.
- Look for a prior trend – When current trends are bullish, it signifies prior trends to be bearish and vice-versa.
A candlestick on an hourly chart depicts the price action for one hour, while a 4-hour stick indicates the price action through the specified four hours in a row. The highest point of the candlestick shows the highest security trading price, while the lowest point displays the lowest price of that time. The candlestick's body (the thicker portions) signifies the opening and closing prices for the period in question.
A blue candlestick means the closing price was higher than the opening price. Likewise, a red candlestick indicates the opening price was higher than the closing price.
Single Candlestick Patterns
1. The Marubozu
Marobozu means “bald head” or “shaved head” in Japanese. This pattern is formed without bothering about what the past trends were. It marks the formation of candlesticks with no shadows, which shows that the security price does not go beyond the opening and closing price. Also, it indicates the specific entry and exit points of a particular trade.
2. The Spinning Top
This candlestick might not provide specific price movement details but offers useful information to indicate the overall current market scenario. The candle has a small real body on a spinning top, which shows the minor difference between the open and close price. In addition, the upper and lower shadows are almost equal, as they connect the candlestick body to the high and low points of the day, respectively.
3. The Dojis
This type of candlestick emphasizes the expected reversals or price changes in the current market. The pattern shows that the open and close security prices are equal. Therefore, Dojis does not have a real body. Investors get to know about the market sentiments using these candlestick patterns.
4. The Paper Umbrella
This candlestick pattern signifies the direction of trades at a specific period. The interpretation of different paper umbrellas depends on where it appears on the chart. It appears on a chart in two forms – indicating bearish trends, referred to as the hanging man, and bullish trends, known as the hammer.
5. The Shooting Star
This candlestick pattern appears as an inverted paper umbrella but has a long upper shadow, normally double the real candlestick body. The longer the upper wick, the more bearish the pattern would be.
The following Nifty Bank Index chart will give individuals, especially the ones new to the world of trading, a clear idea of how the Marubozu pattern works.
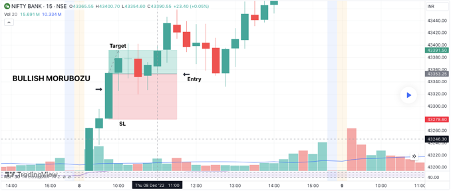
In the above chart, one can identify the bullish Marubozu because of its distinct features, which include the large and lengthy body and little and the lack of upper and lower shadows. Since the bullish or green candlestick appears in an uptrend, it signals the continuation of the upward price movement. If its formation took place at the end of a downtrend, it would indicate a trend reversal. Here, the candle shows that the bulls or buyers in the market are in complete control.
Individuals can find more single candlestick patterns like this on the official website of TradingView to gain better understanding of the concept.
Multiple Candlesticks Patterns
1. The Engulfing Pattern
A single candlestick pattern is enough to help investors identify the trading opportunity. In a multiple candlesticks pattern, at least two to three candlesticks are formed to understand the pattern for making effective trading decisions. The pattern of Day 1 and Day 2 are combined to make an accurate price pattern analysis. The Day 1 candle is smaller than the candle for Day 2, and the latter seems to engulf the former. If the engulfing pattern is observed at the bottom, it is bullish. But if the engulfing pattern is seen on top, it indicates a bearish market.
2. The Piercing Pattern
Unlike the bullish engulfing pattern, in the piercing pattern, the second-day blue candle partially engulfs the lower candle of the first day, which is red.
3. The Dark Cloud Cover
Like the bearish engulfing pattern, the dark cloud cover observes the second day’s red candle engulfing the blue candle of the first day.
4. The Morning Star
It is a bullish candlestick pattern formed by combing three consecutive candlesticks over three days and indicates a downtrend's reversal pattern. It appears at the bottom end of a downtrend.
5. The Evening Star
While the morning star marks a bullish market, the evening star is the opposite. The latter indicates the reversal of the uptrend. This candlestick pattern is also evolved over three-day sessions.
#2 - Bar
Also referred to as open-high-low-close (OHLC), bar charts contain a series of vertical lines, marking the price fluctuation range during a specific time frame. It is one of the easiest charts for investors to interpret. They can identify the open, high, low, and close prices, all at once.
The horizontal dash on the left of the horizontal line indicates the opening price, while the closing price is depicted on the right side of the same line. When the closing price is less than the opening price, the line appears in black or green to indicate the rising period. On the other hand, if the closing price is more than the opening price, the line is represented in red.
#3 - Line Charts
The line charts are formed as a link between different closing prices. This line is traced from left to right, with only the closing prices being pointed on the graphs. These charts are the fundamental form of technical analysis performed by experts.
The best thing about these graphs is that they help get an overall view of the past and present market prices regarding assets investors spend on.
Technical Analysis Indicators
Experts use different indicators to analyze price movements. In addition, they perform the technical analysis of the financial markets, ensuring the reports are accurate enough to guide investors.

Here is a list of technical indicators that traders utilize to assess the market fluctuations for better investment decision-making:
#1 - Moving Averages
It helps traders detect ongoing trading trends. The commonly considered moving averages for the price levels to be checked against are 10, 20, 50, 100, and 200. If the prices go above the moving average, the trend is an uptrend, while if the price moves below the moving average, it marks the downtrend. Moving average is classified into three categories:
- Simple Moving Average (SMA)
- Exponential Moving Average (EMA), and
- Weighted Moving Average (WMA)
#2 - Moving Average Convergence and Divergence (MACD)
MACD suggests whether a particular trend is expected to continue or the pattern is to reverse anytime soon. The indicator uses the MACD line, the difference between the 26 periods EMA and 12 periods EMA, and the Signal line, which is 9 periods EMA. When the MACD line crosses the latter from below, it indicates a buy signal. On the other hand, if the MACD line crosses the signal line from above, investors get a sell signal.
#3 - Relative Strength Indicator (RSI)
It is one of the types of momentum oscillator, besides Rate of Change (ROC) oscillator, Stochastic oscillator, and moving average convergence/divergence oscillator. RSI measures the magnitude of the price fluctuation. It indicates if asset prices are in the overbought or oversold status and the reading falls between 0 and 100. If it is above 70, the prices are in the overbought region, while below 30, it is in the oversold zone.
#4 - Bollinger Bands
It measures the volatility of the market. Three bands are considered in which the first and third band is +2 and -2 standard deviation, with the second one being the 20-day moving average. If the bands expand, it indicates the stock volatility is increasing. On the other hand, if the band contracts, traders understand the stock volatility is decreasing.
#5 - Fibonacci Retracement
It represents support and resistance levels through horizontal lines. Fibonacci retracement is a technical pattern used to predict the predetermined levels at which the stock price or asset is expected to halt and retrace itself. This retracement or reversal could either be upward or downward.
The Fibonacci retracement pattern is formed utilizing the Fibonacci numbers introduced by Italian mathematician Leonardo of Pisa, aka Fibonacci, in the 13th century. This series of numbers is nothing but natural numbers, beginning with 0 and 1. Each next number in the series is derived by adding two previous numbers in the row. Hence, the numbers formed are – 0, 1, 1, 2, 3, 5, 8, 13, 21, 34, 55, 89, 144, 233, 377, and so on.
Further, when the number in the series is divided by the immediate successor, the ratio obtained is equal to 0.618 (e.g., 89/144 = 0.618). When a number in the series is divided by the number placed two places higher, the quotient obtained is 0.382 (e.g., 55/144 = 0.382). Likewise, when a number is divided by the number placed three places higher, the number obtained is 0.236 (e.g., 34/144= 0.236).
These percentages determine the retracement levels and help investors predict the upward or downward movement of the trends.
#6 - Money Flow Index (MFI)
It is a technical indicator that uses both price and volume of assets to identify the overbought or oversold status. Like RSI, MFI also oscillates between 0 and 100. The only difference between the two is that indications from the former are based on the price perspective. At the same time, the latter indicates the market scenario with respect to both price and volume.
Besides the indicators mentioned above, traders also consider other options to ensure the technical analysis reports reflect accurate price movements and depict reliable price patterns. These include – Channel Commodity Index, Donchain, Correlation Coefficient, Price Volume Trend, Stochastic Indicator, etc.
Example
Let us consider the following technical analysis example to understand the concept better:
Jenny decides to buy stocks of Amazon (AMZN). Hence, she conducts technical analysis to find out past trends to ensure the deal would prove to be profitable for her. She analyzes price movements and tracks the same for the next month. The bar chart confused her a bit, which made her use Bollinger bands as an indicator to check how volatile the market was for Amazon.
Based on the same, Jenny asks a few questions to herself, including how she predicts the future prices based on her observations. Finally, as she becomes sure that the market will be lenient for the coming months, she decides to give it a chance and invests in the AMZN stock.
Uses Of Technical Analysis
The technical analysis performed by experts can help:
- Understand the market direction
- Identify price trend signals
- Determine whether a particular trend is going to continue or reverse
- Predict the future price of securities
- Identify potential trading opportunities
- Know entry and exit points in a market
For professional-grade stock and crypto charts, we recommend TradingView – one of the most trusted platforms among traders.
Disclosure: This article contains affiliate links. If you sign up through these links, we may earn a small commission at no extra cost to you.

Frequently Asked Questions (FAQs)
How technical analysis works?
Technical analysis allows investors to forecast the price direction of stocks, futures, bonds, fixed-income products, commodities, or currency pairs based on past data, such as price and trade volume. Traders can use the forecasts to understand the market mood better and select where to invest for profit. This method is frequently employed in behavioral finance and quantitative research.
What is technical analysis in forex?
Forex technical analysis is similar to stock analysis and allows investors to forecast the asset price direction based on previous data. These are best used for developing and executing short-term trading strategies.
What are the two technical analysis approaches?
There are two approaches to technical analysis:
- Top-down – Traders use this method to select a suitable investment by analyzing trading trends ranging from main indexes to sector-specific and regular interval charts.
- Bottom-up – Analysts use this strategy to locate entry and exit opportunities for possible investments by focusing on undervalued equities that ignore the general market trend.
Recommended Articles
This has been a guide to Technical Analysis & its meaning. Here we explain how it works, its charts, indicators, example, and uses in Forex and stock markets. You can learn more from the following articles -
