What Is Weibull Distribution?
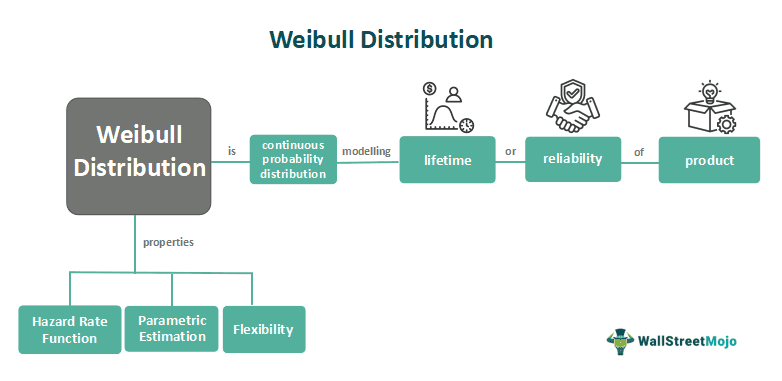
The Weibull distribution is a continuous probability distribution commonly used to model the lifetime or reliability of a product. It is widely applied in various fields such as engineering, reliability analysis, finance, and healthcare. The purpose of the Weibull distribution is to describe the distribution of failure or survival times of a given population.
The importance of the Weibull distribution lies in its flexibility and ability to capture a wide range of failure patterns. Adjusting the shape and scale parameters can model various failure behaviors, such as early failures, constant failure rates, or wear-out failures. This makes it a valuable tool for reliability engineers and analysts to assess and predict the reliability and lifetime of products and systems.
Key Takeaways
- The Weibull distribution is a flexible probability distribution commonly useful in reliability analysis to model product, system, or material lifetime or failure times.
- It can capture various failure behaviors, including increasing, decreasing, or constant hazard rates, making it suitable for analyzing diverse reliability patterns.
- The distribution’s shape and scale parameters allow customization to fit observed data and predict future reliability.
- Its applications extend to fields such as engineering, finance, healthcare, and risk assessment, where it aids in assessing reliability, planning maintenance, and making informed decisions.
Weibull Distribution Explained
The Weibull distribution is a probability distribution used to model the lifetime or reliability of products, systems, or materials. It was introduced by Wallodi Weibull in 1951. It is characterized by two parameters: the shape parameter, which determines the hazard rate’s shape (increasing, decreasing, or constant), and the scale parameter, which determines the location on the time axis. The flexible distribution can capture various failure patterns, making it valuable for reliability analysis. It helps assess and predict the reliability and lifetime of various objects, making it widely used in engineering, finance, healthcare, and other fields.
It is particularly useful for analyzing data where the hazard rate (the probability of failure per unit time) changes over time. The distribution is characterized by the shape parameter (k) and the scale parameter (λ). The shape parameter determines the slope of the hazard rate function, which can be increasing, decreasing, or constant. The scale parameter determines the location of the distribution on the time axis.
Properties
Let us have a look at its key properties:
- Flexibility: The Weibull distribution is highly flexible and can model various failure behaviors. Adjusting the shape and scale parameters can capture various hazard rate shapes, including increasing, decreasing, and constant failure rates.
- Reliability Analysis: The distribution is widely useful in reliability analysis to assess the reliability and lifetime of products, systems, or materials. It provides insights into the failure behavior and helps estimate the probability of survival or failure at different time points.
- Survival and Failure Functions: The Weibull distribution provides convenient survival and failure functions. The survival function gives the probability of an object surviving beyond a specific time, while the failure function gives the probability of failure within a given time frame.
- Hazard Rate Function: The hazard rate function of the Weibull distribution describes the probability of failure per unit time. It can exhibit various shapes, such as increasing, decreasing, or constant, allowing for accurate modeling of different failure patterns.
- Parametric Estimation: The Weibull distribution allows parameter estimation based on observed data. This enables analysts to fit the distribution to empirical data and predict future reliability.
Formula
The formula gives the probability density function (PDF) of the Weibull distribution:
f(x; k, λ) = (k/λ) * (x/λ)^(k-1) * exp(- (x/λ)^k)
Where:
- x is the random variable (typically representing time or a measure of reliability)
- k is the shape parameter, which determines the shape of the hazard rate curve
- λ is the scale parameter, which determines the location of the distribution on the time axis
The formula gives the cumulative distribution function (CDF) of the Weibull distribution:
F(x; k, λ) = 1 – exp(-(x/λ)^k)
This formula gives the probability that the random variable x is less than or equal to a given value.
The hazard rate function (h(x)) of the Weibull distribution is given by:
h(x; k, λ) = (k/λ) * (x/λ)^(k-1)
The hazard rate represents the instantaneous failure rate at time x.
These formulas allow for calculating probabilities, quantiles, and other statistical measures related to the Weibull distribution, facilitating its application in reliability analysis and lifetime modeling.
Applications
Let us have a look at some notable applications:
- Reliability Engineering: The Weibull distribution is extensively useful to model the lifetimes of products, systems, or components. It helps analyze failure patterns, estimate failure rates, and predict the reliability of equipment over time.
- Failure Analysis: By fitting the Weibull distribution to failure data, analysts can identify failure modes, determine the causes of failures, and assess the reliability of different components or materials.
- Quality Control: The Weibull distribution assists in quality control processes by characterizing the failure behavior of manufactured products. It enables manufacturers to set appropriate warranty periods, identify potential issues, and improve product design and manufacturing processes.
- Reliability Testing: The Weibull distribution is useful in accelerated life testing. Products are subjected to accelerated stress conditions to predict their lifetime under normal operating conditions. It aids in determining product durability and reliability under different environments and usage scenarios.
Weibull Distribution vs Normal Distribution
Let us look at the key differences between the Weibull distribution and the normal distribution:
Weibull Distribution vs Lognormal Distribution
Let us look at the key differences between the Weibull distribution and the lognormal distribution:
Frequently Asked Questions (FAQs)
How to estimate the parameters of the Weibull distribution from data?
To estimate the parameters of the Weibull distribution, you can use various methods, such as maximum likelihood estimation (MLE) or the method of moments. MLE maximizes the likelihood function based on the observed data to find the optimal parameter values. The method of moments matches sample moments (e.g., mean and variance) to the theoretical moments of the distribution. There are also software packages and statistical tools available that provide built-in functions for parameter estimation.
Can the Weibull distribution handle censored data?
This distribution is commonly useful to analyze censored data. Here the failure times are only partially observed or right-censored. Employing methods like the maximum likelihood estimation with right-censoring is appropriate to estimate the parameters and make reliable inferences about the distribution.
How to assess the goodness-of-fit of the Weibull distribution to data?
There are several statistical tests and graphical methods to assess the goodness-of-fit of the Weibull distribution. Some common approaches include the Kolmogorov-Smirnov test, Anderson-Darling test, and Q-Q plots. These tests compare the observed data with the theoretical distribution, checking if the differences are statistically significant. Deviations from a straight line indicate departures from the assumed distribution.
Recommended Articles
This has been a guide to what is Weibull Distribution. We explain its formula, applications, comparison with normal and lognormal distributions, & examples. You can learn more about it from the following articles –