Table Of Contents
What Is VXN?
VXN, or the CBOE Nasdaq Volatility Index, predicts the future volatility of the market based on data of the Nasdaq-100 index. Essentially, it takes data from the Nasdaq-100 options to gauge the expected volatility of the upcoming 30 days. The volatility of Nasdaq-100 is directly proportional to the VXN numbers.

The Chicago Board Options Exchange (CBOE) created this index so that investors could watch out for market volatility in the near future. It uses the same methodology as other exchange indexes, such as the CBOE Volatility Index (VIX), which measures the similar volatility of the S&P 500 index.
Table of contents
- What is VXN?
- CBOE’s VXN is an index that indicates predicted volatility for a market within the next 30 days. To do it, the company gets current data and uses it to make predictions.
- The VXN tends to go up when volatility is growing, and it tends to go down when volatility is falling, and hence there is a direct correlation between volatility and the index.
- One can interpret the information on a VXN chart by comparing it to other averages such as the VIX. By using them together, they can check if the trends that they've identified are real.
- While the VXN index tracks the Nasdaq-100 index, the VIX index, which is similar, tracks the S&P 500 using the same metrics.
How Does VXN Work?
VXN was essentially developed by the CBOE to help investors gauge the market trends since there is a massive difference between the volatility measures of Nasdaq-100 and its counterparts. CBOE is one of the largest market operators in the United States. Its first experience with the ones focused on future volatility happened in 1993, with the creation of the VIX.
This index tracked the expected volatility of companies featured on the Standard & Poor’s 500. However, as time passed, the investment platform felt the need to expand. And thus the VXN was introduced into the scene. It uses the Nasdaq-100 as a basis, but it has the same methodology as the other index.
The methodology essentially considers the moves the investors are doing right now to determine how they see the future. To get these numbers, the company analyses all put and call options and open contracts with at least a week of duration, considering how much time they take to expire.
CBOE uses a complex formula to get the final number, which takes all the data into account and comes up with an average of four times per minute. It also uses a filtering algorithm, which filters out any possible technical error.
The index is updated every 15 seconds during trading hours, but it will be shut down as soon as the stock exchanges close for the day. The official time is from 8:30 a.m. CT to 3:15 p.m. CT.
The average number is in the form of a percentage, varying between 0 and 100%. The higher the number, the more volatility we can expect in the future, while lower numbers represent less volatility.
Many traders use Saxo Bank International to research and invest in stocks across different markets. Its features like SAXO Stocks offer access to a wide range of global equities for investors.
How To Interpret VXN?
As we stated before, the VXN is represented by a percentage which is then plotted into a graph. So by looking at it, a person can understand the variations happening in the market.
Such a chart will almost look like this:
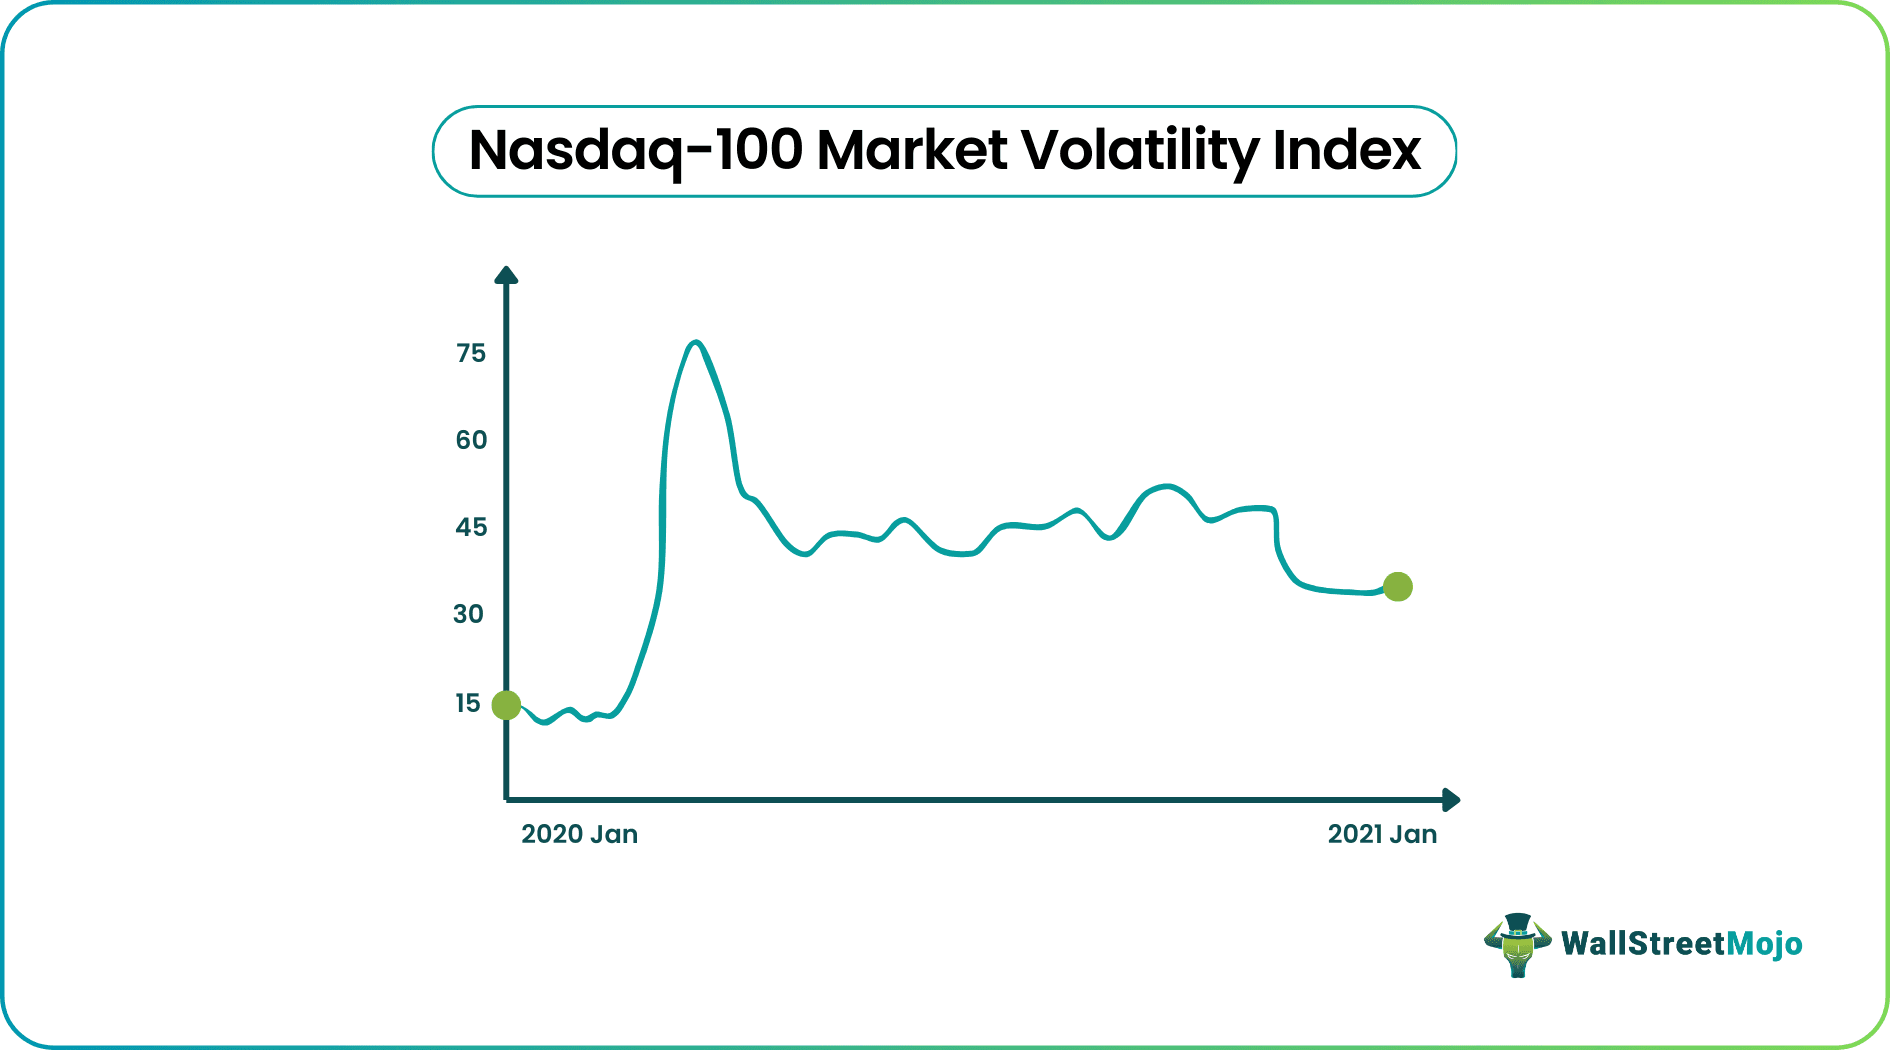
As you can see in the chart, the average VXN went up in a year. It was fairly lower in the first highlight but considerably higher in the second one. During the highlighted periods, it went down in the first, and it remained steady in the second, and by the looks of the long-term picture, the volatility increased.
In markets with a lot of volatility, prices go up and down quickly, which means that more people are trading, and there’s more fear in the market and uncertainty. During an economic crisis or swift changes in the market, volatility is much more common.
If the volatility is decreasing, though, there are fewer people trading, and this may be because the situation is far more stable now. It happens more often in times of steady growth.
It’s important to understand that the VXN does not necessarily indicate actual future volatility but actions that were already made that signal that the investors are expecting volatility.
So, in a way, it’s essentially a “fear gauge,” a term often used to describe this index. It measures how much the investors expect the market to be volatile, which is the only metric that can be used, as the future is impossible to predict.
Note that a person may need more data to determine whether to buy or sell an asset. The expected volatility is only one of the several factors that can affect the market. The more information one is able to track, the more accurate their moves will be.
VXN vs VIX
The CBOE Nasdaq Volatility Index (VXN) and the CBOE Volatility Index (VIX) are similar as they both use the same methodology to track the volatility in the U.S. market.
If the VXN tracks the Nasdaq-100, VIX tracks S&P’s 500. So, to understand how these two metrics diverge from each other, we need to look at what they’re tracking.
These are among the top indexes for U.S. investors, but with a few differences. One of them is the number of companies each index is tracking.
The Nasdaq 100 includes the top 100 companies listed on Nasdaq. The S&P 500, on the other hand, includes the 500 largest publicly traded firms in America. So while both indexes share quite a few companies, one is much larger than the other.
Using both the VXN and the VIX is a great way to see whether a trend is real. A single metric can lead to mistakes, but cross-referencing the data and finding it in two or more distinct sources is the best way to ensure that we are not making a mistake in the predictions.
Disclosure: This article contains affiliate links. If you sign up through these links, we may earn a small commission at no extra cost to you.

Frequently Asked Questions (FAQs)
The VXN measures the market sentiments of the upcoming 30 days based on the Nasdaq-100 index. It uses a variety of data to predict the volatility of the market. The index along with other resources gives the investors an idea about the future market trends and what to expect.
VXN uses the same methodology as VIX, its counterpart, for measuring the volatility of the S&P 500. The calculation involves analyzing all put and call options and open contracts with at least a week of duration. It then takes into account a filtering algorithm and formula in which all the collected data is applied to calculate a finalized number.
Exchange-traded instruments are one of the best ways of trading volatility. Traders can buy or sell exchange-traded funds (ETFs) or exchange-traded notes (ETNs) to trade in VXN.
Recommended Articles
This has been a guide to the VXN index (CBOE Nasdaq Volatility Index). We discuss how to interpret VXN, VXN vs VIX, and its working along with key takeaways.You may learn more from the following articles -
