Table Of Contents
What Is Volume Weighted Average Price?
The Volume Weighted Average Price (VWAP) measures the average price at which a security has traded over a specified period of time, taking into account the volume of shares traded. It is calculated by adding up the dollar value of all trades over the specified period and dividing it by the total number of shares traded. It is used to calculate the average price of a security based on both its price and trading volume.
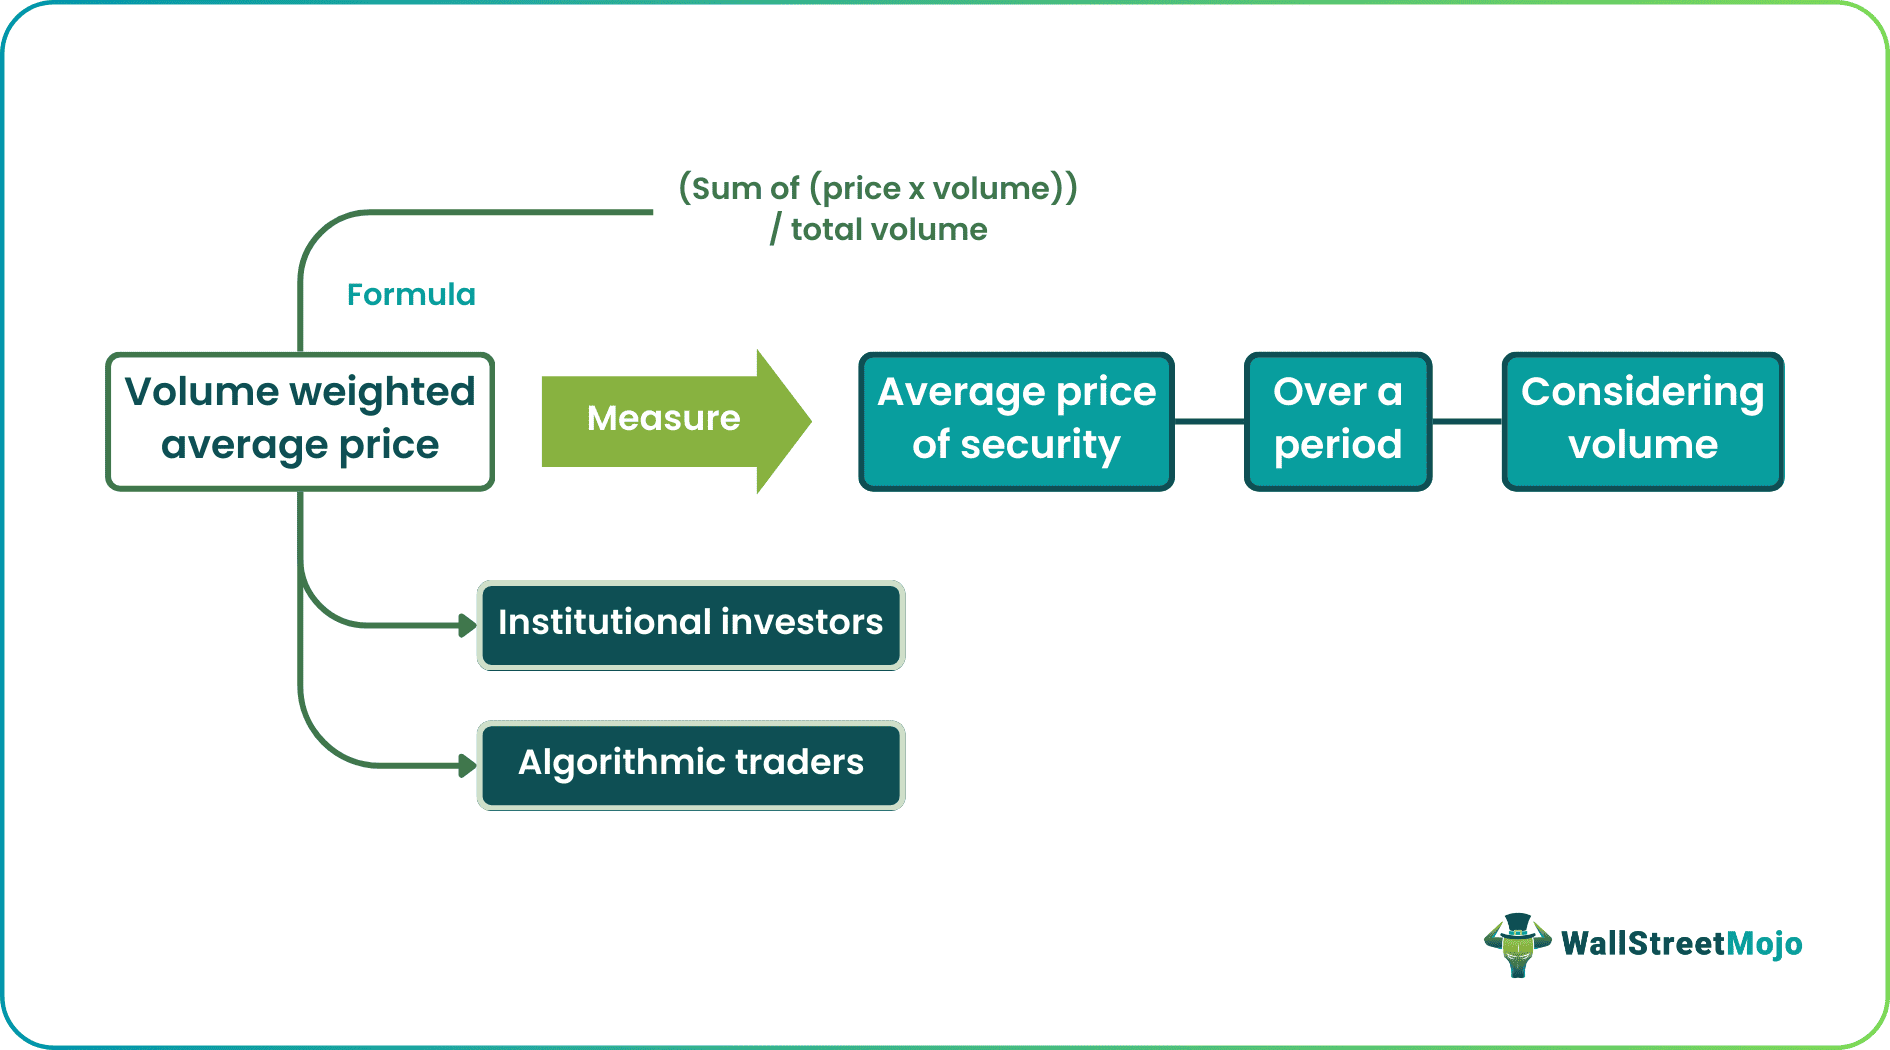
VWAP is often used as a benchmark for institutional investors to assess their trades' performance and compare the price they paid for a security with the prevailing market price. Algorithmic traders also use it as an execution strategy to achieve a better average price for a large volume of shares over a specified period.
Table of contents
- What Is Volume Weighted Average Price?
- VWAP is a technical indicator that measures the average price of a security based on both the price and volume of trades over a specified period.
- It can be used as a benchmark for institutional investors to assess their trading performance and by algorithmic traders as an execution strategy.
- VWAP provides a comprehensive view of a security's price and trading activity and can be useful for traders and investors looking to make informed decisions.
- VWAP has limitations, including a limited time frame, volume dependency, market impact, difficulty in the calculation, lack of interpretability, and inaccurate representation.
Volume Weighted Average Price Explained
The Volume Weighted Average Price (VWAP) is a commonly used trading indicator that provides a comprehensive view of a security's price and trading activity over a specified period. It considers both the price and the volume of trades, making it a more accurate representation of the average price than a simple arithmetic average.
One of the main benefits of VWAP is that it provides a benchmark for institutional investors to assess their trading performance. Hence, it reflects the average price of a security over a specified period. Also, institutional investors can compare the average price they paid for security to its VWAP. It can determine if they paid more or less than the market price and adjust their trading strategies accordingly.
In algorithmic trading, VWAP is often used as an execution strategy for large trades. It helps traders achieve a better average price for a large volume of shares by executing their orders over a specified period rather than all at once. This helps to minimize market impact and avoid sudden price changes that may occur if a large volume of shares is traded all at once.
In summary, the VWAP is an indicator providing a comprehensive view of a security's price and trading activity over time. Also, it considers both the price and volume of trades.
VWAP can be useful in assessing market liquidity. Thus, higher VWAP values may indicate more buying and selling activity in security. Hence, in comparison, lower VWAP values may indicate less liquidity.
Many traders use Saxo Bank International to research and invest in stocks across different markets. Its features like SAXO Stocks offer access to a wide range of global equities for investors.
Formula
To calculate VWAP, one must first determine the total dollar value of all trades in the security over time. This is obtained by multiplying the price of each trade by the number of shares traded. Then, this total dollar value is divided by the total number of shares traded over the specified period. Thus, the formula to calculate the Volume Weighted Average Price is as follows:
VWAP = (Sum of (Price x Volume)) / Total Volume
Where:
- Price is the traded price of a security at a given time.
- Volume is the number of shares traded at that given time.
- The sum of (Price x Volume) represents the total dollar value of all trades in the security over time.
- Total volume is the total number of shares traded over the specified period.
Calculation Example
Here is an example of how to calculate the Volume Weighted Average Price (VWAP) of security:
Suppose a security traded 100 shares for $50, 200 shares at $60, and 150 shares for $70 over a specified period. Thus, to calculate the VWAP, we first need to calculate the sum of the products of price and volume for each trade:
- $50 x 100 = $5,000
- $60 x 200 = $12,000
- $70 x 150 = $10,500
Next, we add up these values to get the total dollar value of all trades:
$5,000 + $12,000 + $10,500 = $27,500
Finally, we divide the total dollar value by the total volume of shares traded:
$27,500 / 450 = $61.11
So the VWAP of the security over the specified time is $61.11. This indicates that, on average, each share of the security traded at $61.11 during that period. It takes into account both the price and volume of trades.
Disadvantages
Here are some of the disadvantages of using this method:
- Limited time frame: VWAP only applies over a specified period and does not provide a full picture of price history.
- Volume dependency: It relies on the volume of trades to be representative. If the volume of trades is low, the VWAP may not be a reliable indicator.
- Market impact: VWAP execution strategies used in algorithmic trading can significantly impact the market, potentially altering the VWAP calculation.
- Difficulty in the calculation: VWAP calculation can be complex, especially for securities that trade frequently and in large volumes.
- Lack of interpretability: VWAP is a technical indicator not easily interpreted by traders and investors unfamiliar with its calculation.
- Inaccurate representation: VWAP does not take into account important market events. Examples include news announcements that can significantly impact a security's price, potentially rendering the VWAP calculation inaccurate.
Frequently Asked Questions (FAQs)
Why Is the Volume-Weighted Average Price Important?
VWAP is an important financial indicator that accurately represents the average price of a stock, commodity, or other tradeable asset. Unlike traditional average prices, VWAP considers both the price and volume of trades made during a specified period, which gives a better picture of the asset's true market value and the prevailing market sentiment.
Is VWAP a reliable indicator?
VWAP is widely considered a reliable indicator by institutional traders and investors. This is because it provides a more comprehensive picture of the average price of an asset. In addition, it considers the price and volume of trades made during a specified period. This helps better represent the asset's true market value and prevailing market sentiment.
Is VWAP bullish or bearish?
VWAP is a neutral indicator and does not indicate a bullish or bearish market trend. Furthermore, VWAP calculates an asset's average price based on price and volume. Therefore, it does not provide insight into market sentiment or future price movements. Nevertheless, traders and investors may use VWAP and other technical indicators and analysis techniques to form a view of market trends and make informed investment decisions.
Disclosure: This article contains affiliate links. If you sign up through these links, we may earn a small commission at no extra cost to you.

Recommended Articles
This is a Guide to what is Volume Weighted Average Price (VWAP). Here we explain its formula along with a calculation example and its disadvantages. You may have a look at these articles below to learn more –
