Table Of Contents
Volatility Meaning
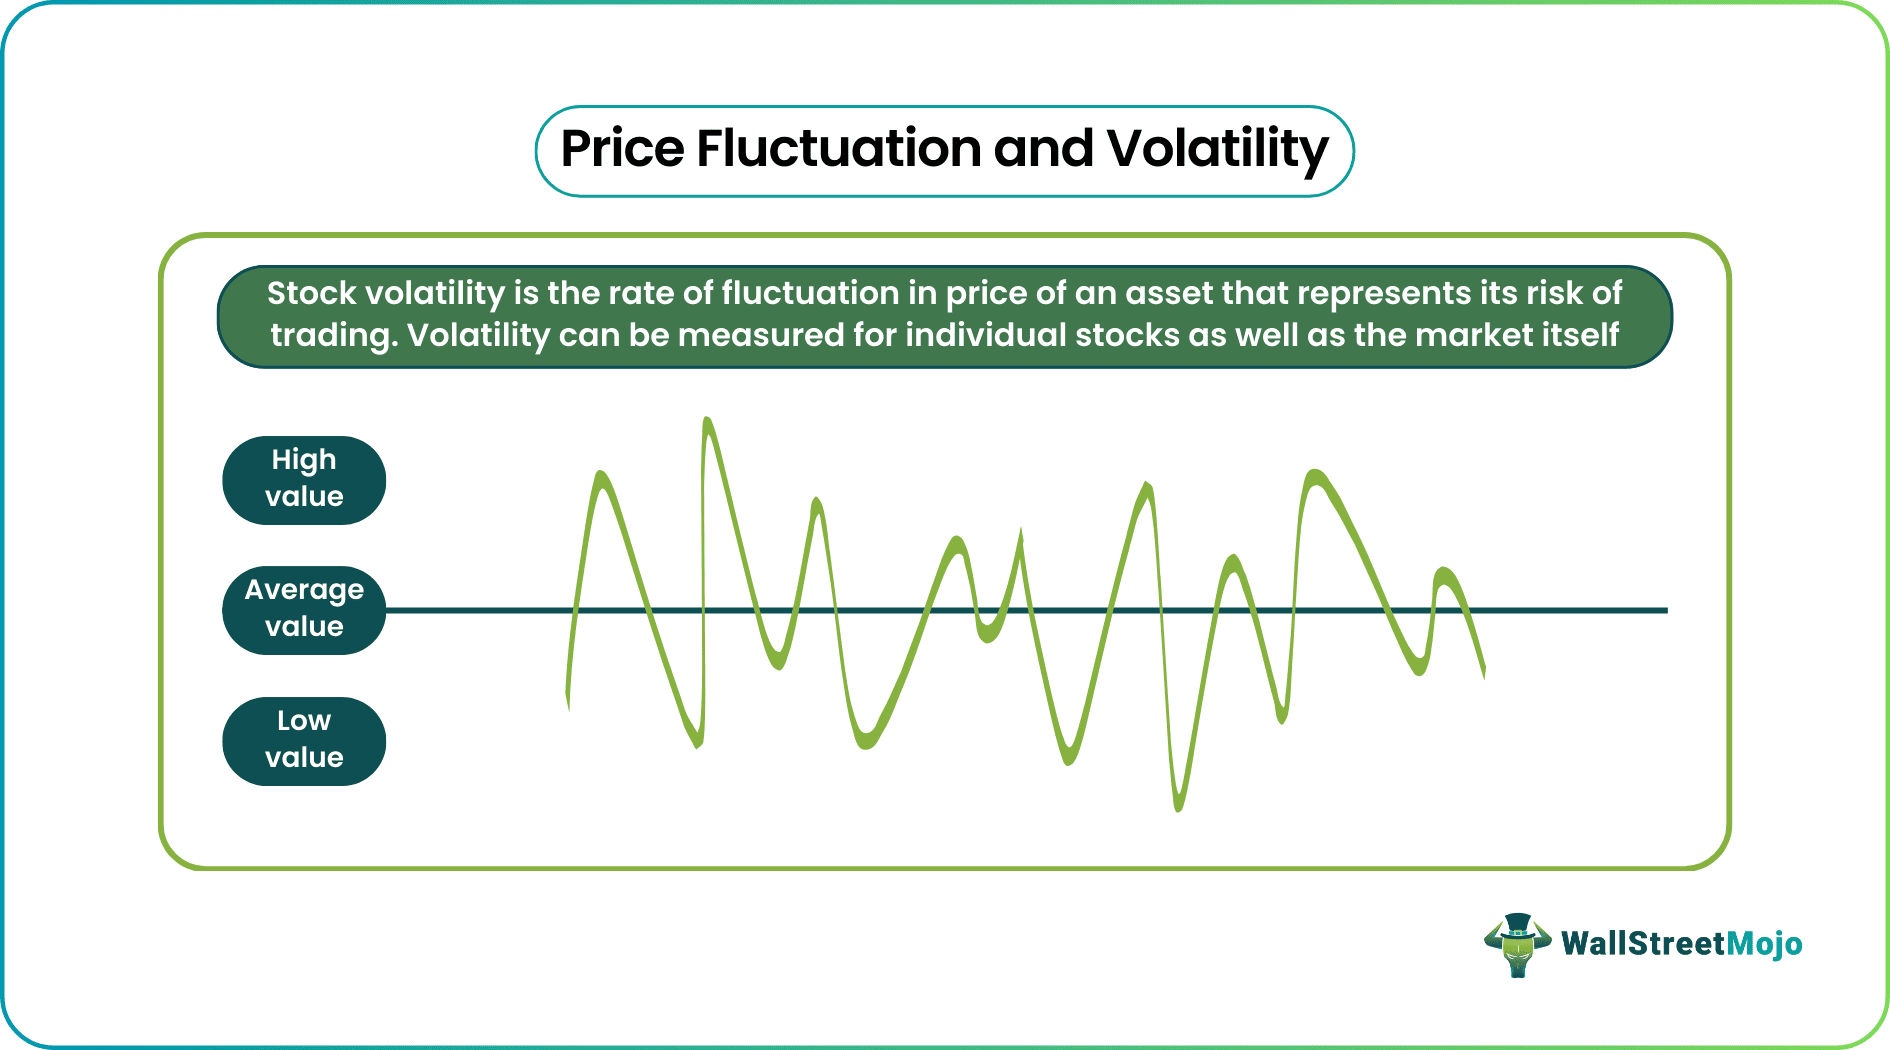
Volatility is the rate of fluctuations in the trading price of securities for a specific return. It is the shift of asset prices between a higher value and a lower value over a specific trading period. When changes are big, and they occur frequently, the market is more volatile.

Volatility acts as a statistical measure for analysts, investors, and traders, allowing them to understand how widely the returns are spread out. The volatile nature of an asset is directly proportional to the risk it bears. This means that the investment can either bring huge profits or devastating losses.
Table of contents
- Volatility Meaning
- Volatility is the frequent oscillation of prices between different highs and lows of an underlying asset in a particular trading period. It is an indicator of the underlying risk of a security or market itself.
- It can be termed good and bad, depending on the investor. An investor willing to take high risks may be rewarded with high gains. Conversely, those who intend to make short-term gains can benefit from uncertainty. However, investors cannot ignore the risk factor here.
- Many factors contribute to volatility, including undesirable political developments, unfavorable monetary policies, market sentiments, etc.
Volatility Explained
Volatility is the oscillation of prices between high and low values from an asset's average market performance. Since there is no uniformity in price range, it represents risky behavior. A low volatile value indicates a positive outcome. It is safe in terms of risk, whereas a high volatile value indicates higher chances of negative results and, therefore, low safety scores.
Volatility can be of two types - historical and implied. Both are expressed in percentages and standard deviations (+/-).
The former helps investors analyze an asset's average performance, compare it against set intervals, and measure the deviations from that average. If the value rises consistently, there is a cause of concern as it usually denotes that changes are waiting to happen with the asset. On the other hand, if it is declining, it suggests that things will stabilize and go back to normal. Therefore traders use projections as a means to estimate future volatility.
The latter helps investors make price predictions based on the historical price behaviors of securities. However, it is more complex as it predicts future activity based on current prices. A rise in historical volatility suggests a change that has already happened or is about to happen. A dip in the same indicates a more predictable trend.
Many traders use Saxo Bank International to research and invest in stocks across different markets. Its features like SAXO Stocks offer access to a wide range of global equities for investors.
Calculating Volatility (in Stock Market)
Volatility can be calculated with the help of variance and standard deviation. Let us take a look at an example to see how:
Jake is a new investor, and he wants to understand the nuances of the market. To understand the basics of arriving at the values, he needs to execute the following steps:
1. He has to derive the data set's mean value by adding each of the values and dividing them by the number of values. Suppose the closing prices of a few months for xyz stock are $5, $10, $15, $20, and $25 for a certain period.
Hence, the mean of the values = (5+10+15+20+25)/5
= 75/5
= 15
2. The next step is to calculate the differences between each data value and the mean, so the values are
- 25-15=10
- 20-15=5
- 15-15=0
- 0-15=-5
- 5-15=-10
3. The deviations are then squared to eliminate negative values. The new set of values is 100, 25, 0, 25, and100.
4. Now, the sum of the values is given by, S= 100+25+25+100= 250
5. The arrived value is then divided by the count of data values which gives the variance
Therefore, Variance= 250/5= 50
And Standard deviation= square root of variance=7.07
This value serves as a guide to how much the price can deviate from the average to measure risk.
For simple volatility calculation, many prefer the above method.
Besides the standard deviation method, the Black-Sholes formula gives the measure of implied volatility. The formula is:
C=StN(d1)-Ke-rtN(d2)
Where N is the normal distribution, St is the spot price which is the underlying asset's price, K is the strike price, r is the risk-free interest rate, t is the maturity time, and d1 and d2 are the standard deviations.
Causes of Stock Market Volatility

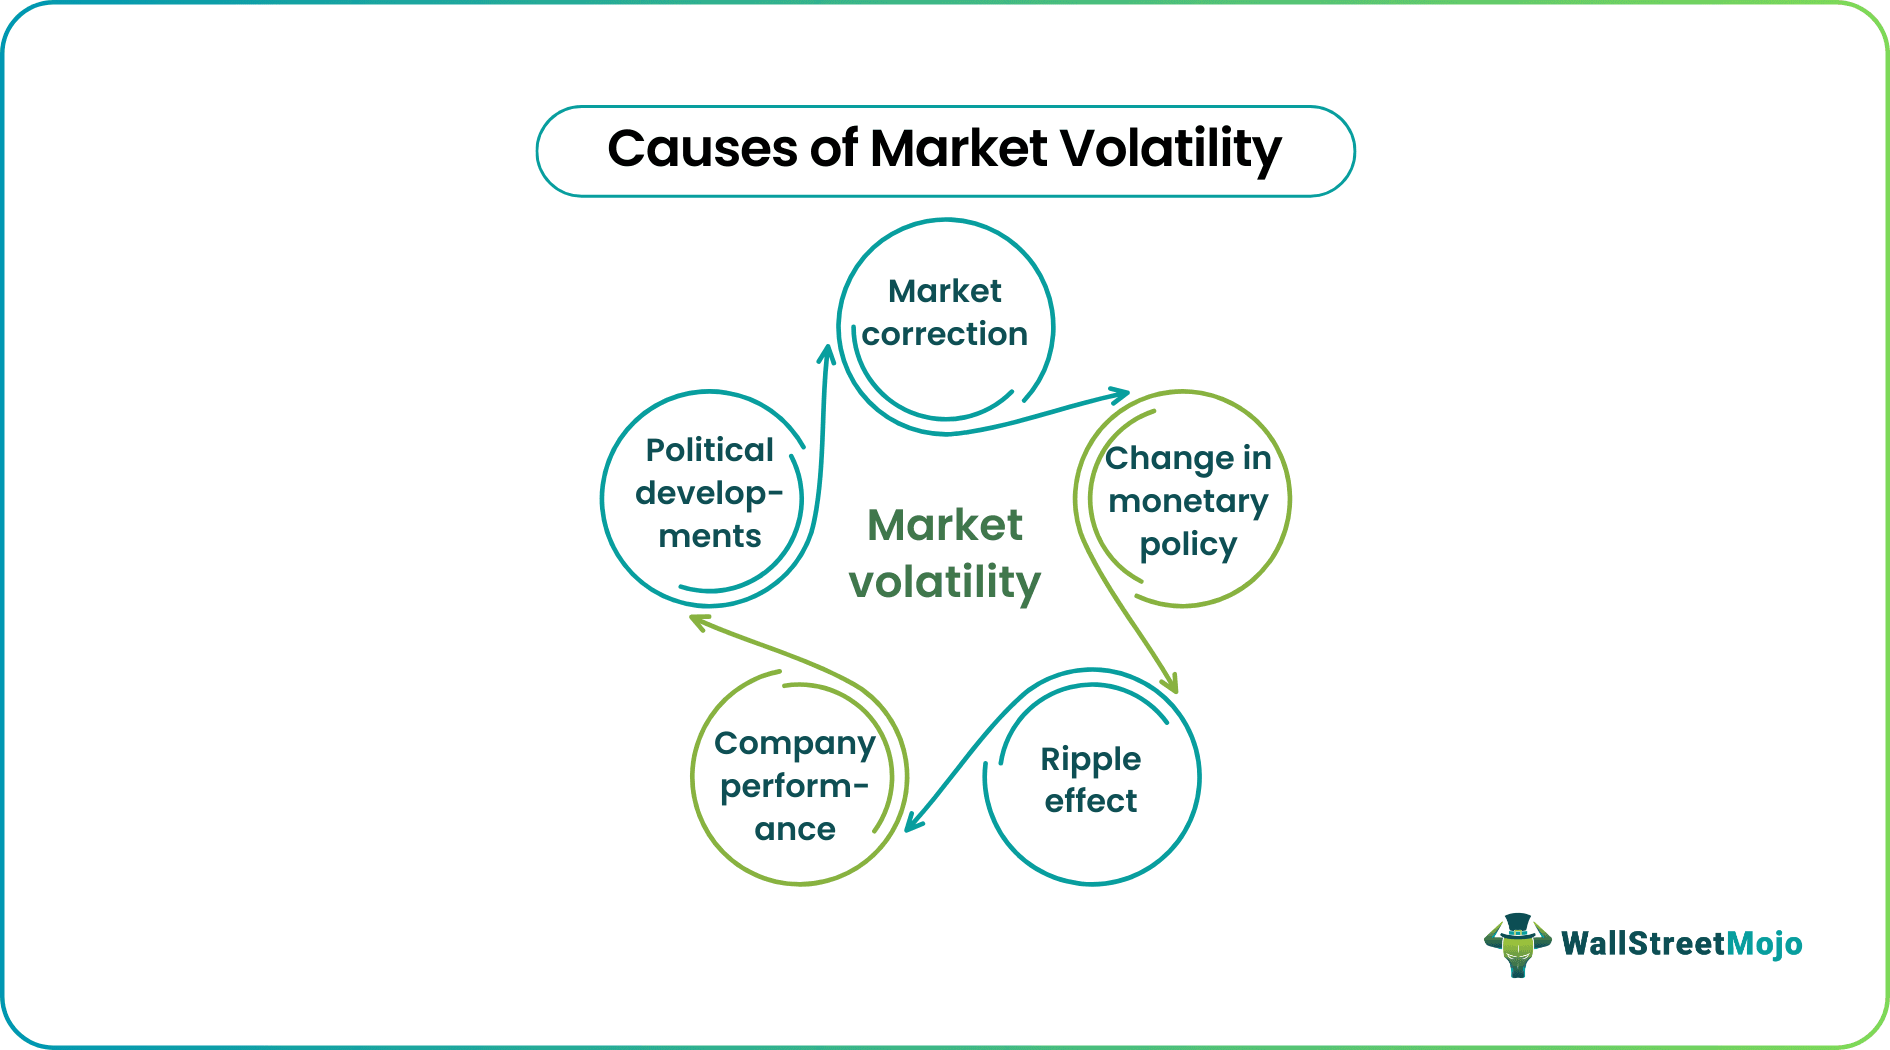
Factors that cause stocks to be volatile are also uncertain. However, a few pointers may induce frequent price fluctuations in the market. Such as:
#1 - Monetary policy changes
At times, the government announces an increase in long-term capital gains tax for equities from a particular date. Investors who want to avoid paying taxes in large amounts will sell to make profits. Those who wish to take advantage of the low price will buy simultaneously, leading to the rise and fall of prices.
#2 - Market correction
Any market that has been performing well for some time will experience this. Investors who have held on for a long time will lookout for a time to book profits. It could be through selling or trading, causing the market to be volatile. The market correction in 2020 due to the pandemic lasted almost three months and is a good example.
#3 - Political developments
Governments are the regulatory authority. They decide trade laws, taxes, and tariffs associated with the same. The market, therefore, watches them carefully. Sometimes, rumored policies, especially during elections, can cause knee-jerk reactions within the investment community.
For instance, in 2018, the U.S. and China had an escalating trade war, the U.S announced tariffs, and soon enough, the U.S. stock market took a tumble.
#4 - Ripple effect
The Ripple effect is where the action of market prices in one part of the world impacts the rest of the world. For example, suppose there is news that someone used stock market profits for money laundering activities. The origin country might see a volatile market, and hearing the news, investors panic and start buying or selling in other parts of the world. It can lead to a string of actions that result in unfavorable outcomes.
The 1929 stock market crash is an example of such mass panic and ripple effect.
#5 - Company performance
Stock prices of companies can become volatile if there is any positive or negative news. For example, a big corporation of massive size can see a downslide in prices if there is negative news. At the same time, the investors who sold this particular company's stock will be looking out for other companies to invest in, and demand for those stocks will increase simultaneously. Such volatility trading contributes to unpredictable selling and buying in the market.
Disclosure: This article contains affiliate links. If you sign up through these links, we may earn a small commission at no extra cost to you.
Frequently Asked Questions
Volatility is the frequent price fluctuations experienced by underlying security in a financial market. It is otherwise the rate at which the price rapidly increases or decreases. When the prices hit new highs and lows in a short period, the asset is said to have high volatility and is, therefore, riskier to trade.
The stock volatility value is arrived at by calculating the standard deviation from the average price of the stocks, and implied volatility is generally calculated through the black-Sholes formula given by C=StN(d1)-Ke-rtN(d2). The CBOE Volatility Index (VIX) can be a good Volatility indicator to help investors decide which stocks to invest in without making difficult volatility calculations.
Volatility can be good and bad, depending on the investor. If the investor intends to make money in uncertainty, they can make short-term profits through swing trading or intraday trading. Day traders use volatile prices daily (within minutes and seconds), while swing traders wait for days or weeks to trade.
Recommended Articles
This has been a guide to Volatility and its Meaning. Here we explain volatility calculation (in stock market) and their explanations with causes. You can learn more about accounting from the following articles –

