Table Of Contents
Excel VBA PowerPoint
Using VBA, we can automate the work we do for PowerPoint. But first, to use VBA code or snippets to work in PowerPoint, first work through the security options in PowerPoint to enable all Macros. Then, we can use PowerPoint VBA reference for Macros in MS PowerPoint.
The beauty of VBA is that we can reference other Microsoft products like "Microsoft Word" and "Microsoft PowerPoint." We usually create reports in Excel and then create PowerPoint presentations. All Excel users usually spend a considerable amount of time preparing the presentation from Excel data and reports. If you spend considerable time preparing PowerPoint presentations, this tutorial will show you how to create a PowerPoint presentation from Excel using VBA Coding.
Enable Powerpoint Object Model
Let us follow the below steps..
- Open "VBA Editor." Then, go to "Tools" and "References."

- Now, you will see all the references to the "VBA Project." Scroll down and select "Microsoft PowerPoint 15.0 Object Library".

- Click on "OK." Now, we can access PowerPoint from Excel.

VBA Tutorial to Create PowerPoint Presentation
We can create PPT in "Early Binding" and "Late Binding." Finally, we will show you how to create a PowerPoint presentation using the “Early Binding” technique.
Usually, from Excel, we prepare presentations based on charts and interpretation of the charts. So, for this purpose, we have created some simple excel charts and interpretations in the same worksheet.


Step 1: Start the subroutine in VBA. We have already enabled the PowerPoint object model in the earlier steps to access PowerPoint. To access this, we need to declare the variable as PowerPoint.Application.
Code:
Sub PPT_Example()
Dim PPApp As PowerPoint.Application
End Sub
Step 2: To add the presentation to PowerPoint, we need to declare a variable as PowerPoint.Presentation.
Code:
Dim PPPresentation As PowerPoint.Presentation
Step 3: After adding the presentation to the PowerPoint, we need to add a Slide to declare the variable as PowerPoint.Slide.
Code:
Dim PPSlide As PowerPoint.Slide
Step 4: Once we add the slide to the PowerPoint, we need to use shapes in the PowerPoint, i.e., text boxes, to declare a variable as PowerPoint.Shape.
Code:
Dim PPShape As PowerPoint.Shape
Step 5: Now, we need to declare the variable as Excel to access all the charts in the worksheet.ChartObjects.
Code:
Dim PPCharts As Excel.ChartObject
These variables are enough to start the proceedings.
Step 6: Now, we need to launch the PowerPoint from Excel. Since it is an external object, we need to set this as a new PowerPoint.
Code:
Set PPApp = New PowerPoint.Application
It will launch the new PowerPoint from Excel.
Step 7: The variable PPApp is equal to the PowerPoint we launched. Now, make this PowerPoint visible and maximize the window.
Code:
PPApp.Visible = msoCTrue
PPApp.WindowState = ppWindowMaximized
Now, just run the code using the F5 key or manually. You should see the PowerPoint app launched like the one below.

Step 8: We need to add a presentation to the PowerPoint app we have launched.
Code:
Set PPPresentation = PPApp.Presentations.Add
Now, we should see the PowerPoint presentation like this.

Step 9: We need to add a slide after adding the presentation
Code:
Set PPSlide = PPPresentation.Slides.Add(1, ppLayoutTitleOnly)
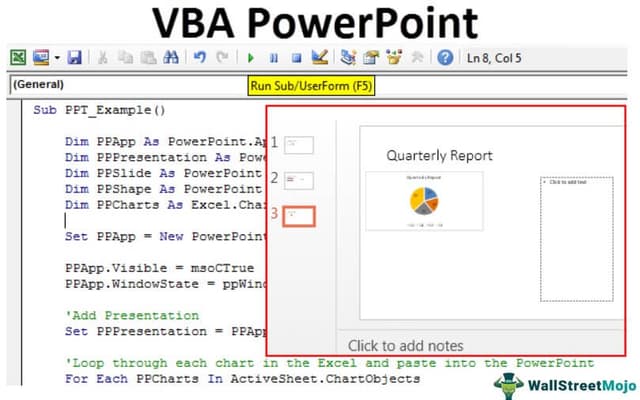
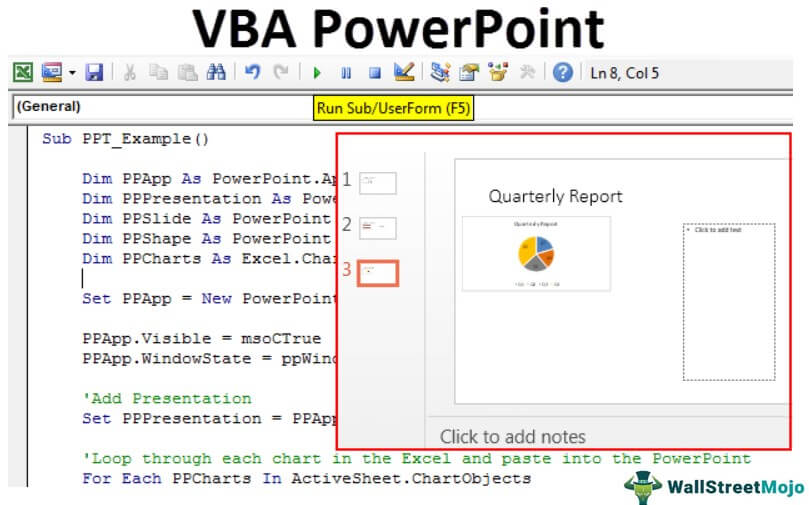
Now, this will add the title slide like the below.

Step 10: Now that we have more than one chart in the worksheet, we need to loop through each chart and paste it into the presentation. Below is the code to copy and paste the chart and interpretation.
Below is the complete code for you.
Sub PPT_Example()
Dim PPApp As PowerPoint.Application
Dim PPPresentation As PowerPoint.Presentation
Dim PPSlide As PowerPoint.Slide
Dim PPShape As PowerPoint.Shape
Dim PPCharts As Excel.ChartObject
Set PPApp = New PowerPoint.Application
PPApp.Visible = msoCTrue
PPApp.WindowState = ppWindowMaximized
'Add Presentation
Set PPPresentation = PPApp.Presentations.Add
'Loop through each chart in the Excel and paste into the PowerPoint
For Each PPCharts In ActiveSheet.ChartObjects
PPApp.ActivePresentation.Slides.Add PPApp.ActivePresentation.Slides.Count + 1, ppLayoutText
PPApp.ActiveWindow.View.GotoSlide PPApp.ActivePresentation.Slides.Count
Set PPSlide = PPApp.ActivePresentation.Slides(PPApp.ActivePresentation.Slides.Count)
'Copy the chart and paste in Powerpoint
PPCharts.Select
ActiveChart.ChartArea.Copy
PPSlide.Shapes.PasteSpecial(DataType:=ppPasteMetafilePicture).Select
'Add heading to the slide
PPSlide.Shapes(1).TextFrame.TextRange.Text = PPCharts.Chart.ChartTitle.Text
'Allignment of the chart
PPApp.ActiveWindow.Selection.ShapeRange.Left = 15
PPApp.ActiveWindow.Selection.ShapeRange.Top = 125
PPSlide.Shapes(2).Width = 200
PPSlide.Shapes(2).Left = 505
'Add interpretation
If InStr(PPSlide.Shapes(1).TextFrame.TextRange.Text, "Region") Then
PPSlide.Shapes(2).TextFrame.TextRange.Text = Range("K2").Value & vbNewLine
PPSlide.Shapes(2).TextFrame.TextRange.InsertAfter (Range("K3").Value & vbNewLine)
'Else if the chart is the "Renewable" consumption chart, then enter the appropriate comments
ElseIf InStr(PPSlide.Shapes(1).TextFrame.TextRange.Text, "Month") Then
PPSlide.Shapes(2).TextFrame.TextRange.Text = Range("K20").Value & vbNewLine
PPSlide.Shapes(2).TextFrame.TextRange.InsertAfter (Range("K21").Value & vbNewLine)
PPSlide.Shapes(2).TextFrame.TextRange.InsertAfter (Range("K22").Value & vbNewLine)
End If
'Now let's change the font size of the callouts box
PPSlide.Shapes(2).TextFrame.TextRange.Font.Size = 16
Next PPCharts
End Sub
