Table Of Contents
Variability Meaning
Variability is a statistical notion that determines the spread among the data points in a data set. It ascertains how much a data point varies from the other data points or the central value. Thus, it is a widely used measure in statistical analysis to gauge the dispersion of the data.
It is an essential phenomenon in science, finance, investment, social science, etc., where data analysis is critical to every research and decision-making. High variability in a data set indicates that the data points are widely dispersed, while low variability indicates that they are tightly clustered around a central value.
Key Takeaways
- Variability is a statistical measure for the divergence or spread of a data point from the other data points or the central value of a data set.
- It is crucial for statistical research and analysis in science, finance, investment, healthcare, etc. The different measures of variability are standard deviation, variance, range, and interquartile range.
- The variability of a data set is highly sensitive and directly related to the width of data distribution.
Variability Explained
Variability in statistics is a crucial factor behind the decision-making and interpretation of the results of a research or analysis. Measures of variability help understand the characteristics of a data set and can provide insights into the underlying patterns or trends. Moreover, it provides information about the spread or dispersion of values within the data.
Thus, the greater the degree of variability, the more spread out the data points are from the central tendency (mean, median, etc.), and vice versa. They are commonly used for research and analysis in various fields, including science, finance, stock market, healthcare, social science, etc.
Furthermore, in the financial market, an investor considers the variability in asset returns, I.e., stocks, bonds, commodities, and derivatives, before investing in it to understand its degree of volatility and level of risk involved. Thus, high variability in investment means high risk, and the investors often seek high returns (or risk premiums) from these high-risk instruments. However, an asset with high variability and poor returns fails to attract investors. Also, investors who want to hold low-risk, limited-return assets will search for investment options with low variability.
Hence, understanding variability is fundamental in statistical analysis. It helps researchers and analysts assess the reliability of their findings, identify patterns in data, and make more informed decisions based on the level of variability present in a dataset. Additionally, this statistical notion is also used in big data. Therefore, organizations often deploy advanced analytics, machine learning, and data preprocessing techniques to manage variability in big data effectively.
Hence, the coefficient of variability is particularly useful when comparing the relative variability of two datasets with different means or units. However, a lower coefficient of variation indicates less relative variability, while a higher coefficient of variation suggests more significant relative variability.
Measures
The measures of variability are statistical tools that help to identify the degree of spread out or dispersion in a data set. There are four primary statistical measures of variability as follows:
- Range: The range is the simplest measure of variability and is calculated by deducting the lowest value of a data set from the highest value. It provides a limit within which all the data points are situated in a data set.
- Interquartile Range (IQR): The interquartile range is another measure of variability based on the dataset's quartiles. It is calculated as the difference between the 75th percentile (third quartile) and the 25th percentile (first quartile) of the data. Hence, the mean absolute deviation is the average of the absolute differences between each data point and the mean.
- Variance (σ2): The variance gauges the extent of data dispersion from the average or central value. It is a widely applicable tool for investors and analysts to determine the risk profile of an asset and compare the performance of various investment products.
- Standard Deviation (SD or σ): The standard deviation is again a dispersion indicator. In stock markets, the assets with high standard deviations are considered to be more volatile. However, stable stocks like blue-chip funds have a low standard deviation.
Formula
The different measures of variability have different calculations and formulae, as discussed below:
#1 - Range
It is one of the easiest variability measures where the observations or values are arranged in ascending order. Then, the following equation is used:
Range = Xmax – Xmin
Where Xmax is the highest or maximum value or highest observation, and
Xmin is the lowest or minimum value or lowest observation.
#2 - Interquartile Range (IQR)
Another measure of variability based on the quartiles of the dataset is the interquartile range. It is determined as the difference between the data's third-quartile 75th percentile and first-quartile 25th percentile. The sum of the absolute deviations between each data point and the mean is the mean absolute deviation.
IQR = Q3 – Q1
Where Q1 = N/4 and Q3 = 3N/4, while N is the total number of values or observations in a data set.
#3 - Variance
The variance is calculated as the average squared differences between each data point and the mean. The equation is:
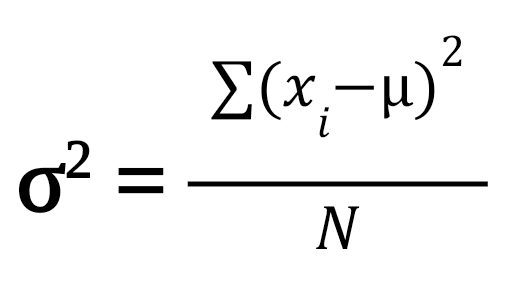
- Where xi is the data point,
- µ is the average or mean value,
- n is the total number of values
#4- Standard Deviation
The standard deviation is evaluated as the variance's square root. Its formula is:
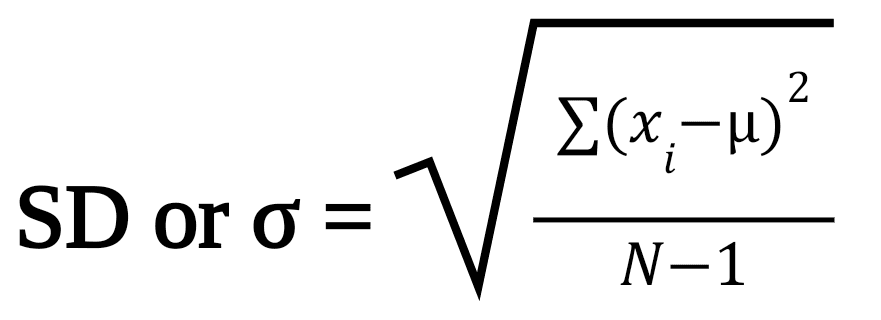
- Where xi is the data point,
- µ is the average or mean value,
- n is the total number of values
Examples
Let us understand the concept better with the help of examples.
Example #1
Suppose the price of a stock in the last twelve months is $12.3, $13.1, $13.7, $12.9, $11.4, $11.8, $12.2, $12.3, $11.5, $11.7, $12, $12.1.
Determine the range and interquartile range of the stock price movement.
Solution:
Arranging the price in ascending order:
$11.4, $11.5, $11.7, $11.8, $12, $12.1, $12.2, $12.3, $12.3, $12.9, $13.1, $13.7
Range = Xmax – Xmin = $13.7 - $11.4 = $2.3
IQR = Q3 – Q1 = $12.3 - $11.7 = $0.6
The range of stock price movement is $2.3, while the interquartile range is $0.6 in the last year.
Example #2
Determine the standard deviation and variance if a stock price movement for the last five days was as follows:
| Day | Stock Price | xi - µ | (xi - µ)² |
|---|---|---|---|
| 1 | $4.5 | $0.1 | 0.01 |
| 2 | $4.6 | $0.2 | 0.04 |
| 3 | $4.2 | -$0.2 | 0.04 |
| 4 | $4.3 | -$0.1 | 0.01 |
| 5 | $4.4 | 0 | 0 |
| Total | $22.0 | 0.1 |
µ = 22/5 = $4.4
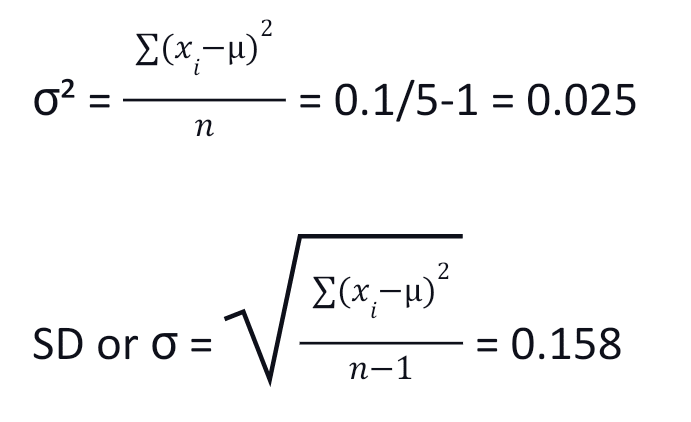
Thus, the variance and standard deviation are low in this case, indicating that the stock is not very volatile and involves low risk but offers little returns.
Variability vs Variation
Most often, variability and variation are used interchangeably as synonyms. However, there is a fine line of difference between the two, as discussed below:
- Variability refers to the degree to which a data point diverges from the central value or other data points. However, variation is a change in the state, form, groups, features, or qualities of something over time.
- The former is a statistical measure to determine the distance between the data points from one other or the mean. Hence, the latter denotes a set of identified differences in a particular system or process.
- Moreover, variability is a measure of variation considering the statistical data, but variation is a broader concept that showcases the difference from the standard values.
