Table Of Contents
What Is VAR.S Excel Function?
The VAR.S Excel function is an inbuilt Statistical function. It determines the variance based on the given sample of an entire population while ignoring the text and logical values in the sample data.
Users can use the VAR.S Excel function to estimate the amount of risk associated with an investment. Also, the function helps confirm if the investment will be profitable based on a sample of the entire data.
For example, the following image shows a sample of an entire dataset containing a list of students and their Mathematics project scores out of 20.
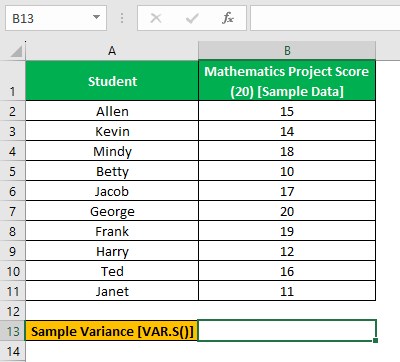
The task is to determine the sample variance based on the given sample data and display the output in cell B13.
Then, considering the above-explained VAR.S Excel meaning, we can apply the VAR.S Excel function in the target cell to achieve the required output.
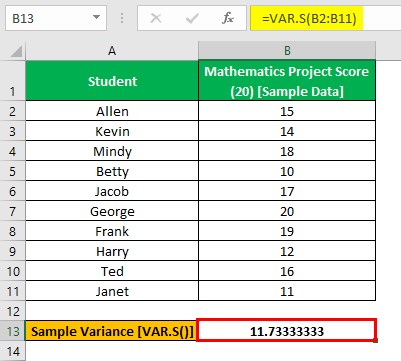
In the above VAR.S Excel function example, the VAR.S() accepts the range B2:B11 containing the sample data points.
So, the function determines the sample variance based on the input as 11.73333333, which indicates the amount of dispersion of the sample data around its mean value.
Table of contents
- The VAR.S Excel function determines the sample variance based on the given sample of an entire population.
- Users can use the Excel VAR.S function in the accounting and budgeting processes. Also, the function is useful for evaluating the market stability and better forecasting to run the business operations with improved efficiency.
- The Excel VAR.S function accepts one mandatory argument, number1, and 2 to 254 optional arguments, number2, number3, and so on.
- The Excel VAR.S function output will be incorrect if the given dataset is the whole population. In such a case, we must use the VAR.P Excel function.
Syntax
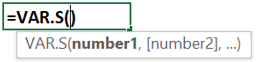
The VAR.S Excel formula syntax is as follows:
Where,
- number1: The argument representing the first number required to calculate the sample variance corresponding to a population’s sample.
- number2, …: The 2-254 number arguments corresponding to a population’s sample.
While the first argument in the VAR.S Excel formula is mandatory, the remaining arguments are optional.
Furthermore, below are a few aspects of the VAR.S Excel function arguments to follow to avoid errors:
- Excel offers multiple inbuilt functions, one of them being the VAR.P Excel, to determine variance. So, when we are not sure whether to use VAR.P or VAR.S Excel function, check if the given data is a sample of the population. And if it is, then use the VAR.S Excel function. Otherwise, use the VAR.P(), which returns the variance of the entire population.
- The VAR.S() will work only when the sample supplied as input to the function contains a minimum of 2 valid elements.
- The VAR.S Excel command arguments can be numbers, names, arrays, or references to cells or ranges containing the sample data points.
- Typically, the VAR.S Excel function ignores texts, logical values, and blank cells. However, the function considers them if supplied directly as blanks, logical values and text representation of numbers in the function’s arguments list and returns an error.
- If the supplied argument value is an array or reference, the VAR.S Excel command only counts the numbers in the array or reference. On the other hand, the function ignores blank cells, texts, logical values, and error values in the array or reference.
- If the supplied error values or texts cannot translate into numbers, the function output can be an error value.
How To Use VAR.S Function In Excel?
We can use the VAR.S Excel function in two ways:
- Access the function from the Excel ribbon.
- Enter the function into the worksheet manually.
Method #1 – Access The Function From The Excel Ribbon
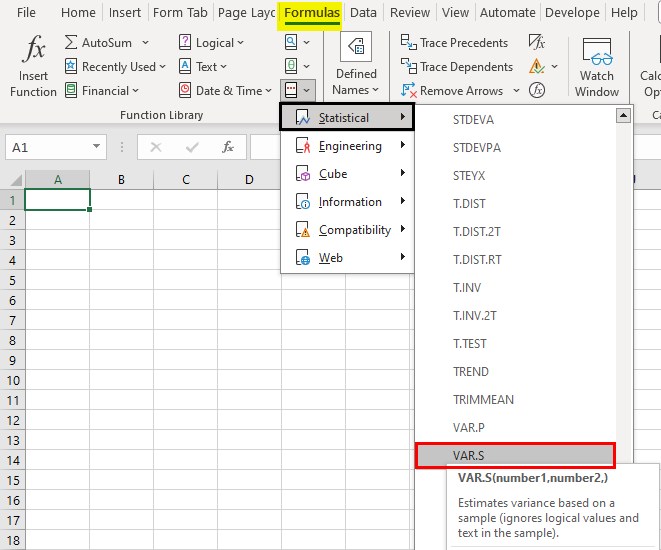
Choose a target cell for output - The Formulas tab - The More Functions group down arrow - The Statistical function group right arrow - The VAR.S Excel function.
The Function Arguments window will open. Update the arguments in the Number1, Number2, … fields.
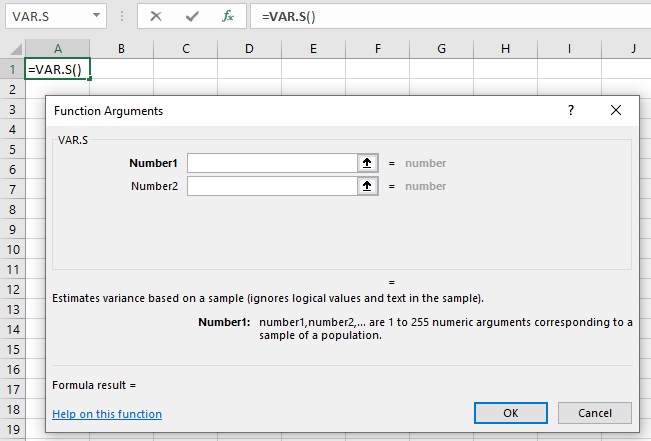
Furthermore, clicking the Number2 field will show the next field, Number3, clicking which will show the subsequent field, and so on to update in the Function Arguments window.
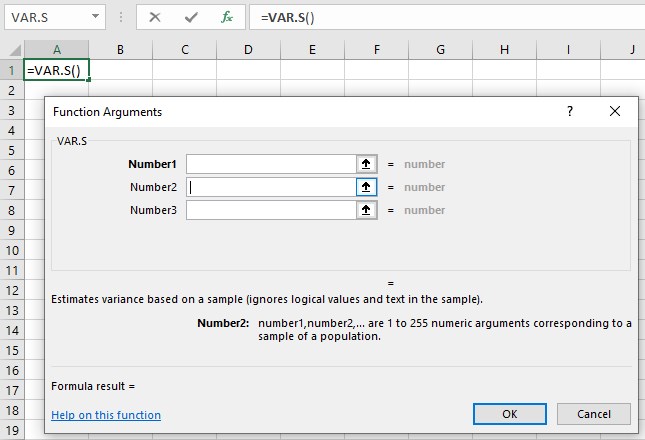
Finally, once we update all the required fields, click OK in the Function Arguments window to view the VAR.S() output in the target cell.
Method #2 – Enter The Function Into The Worksheet Manually
- Choose a target cell for the output.
- Type =VAR.S( in the cell.
- Enter the arguments, separated by commas and close the brackets.
- Press Enter to execute the VAR.S Excel function and achieve the required sample variance value.
Examples
Check out the following examples to understand the VAR.S Excel meaning better to use the function effectively.
Example #1
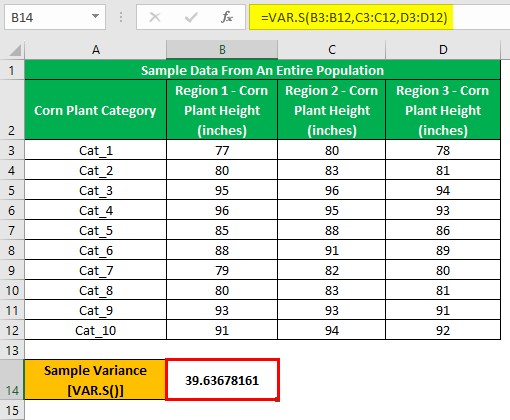
The following dataset shows a sample of data containing the heights of different categories of corn plants.
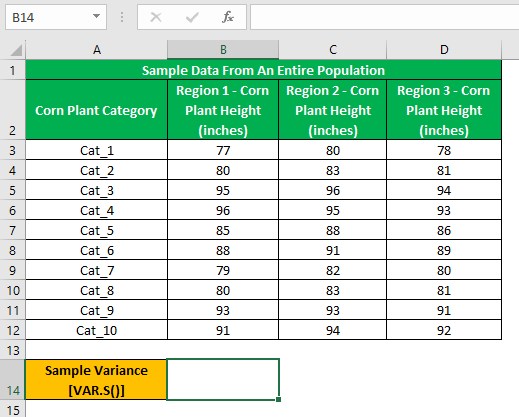
The aim is to determine and display the variance for the given data in cell B14. However, we might be confused about whether to apply the VAR.P or VAR.S Excel function in the target cell.
In this example, the given data is a sample of an entire dataset or population, implying that we must use the VAR.S Excel function.
Step 1: Choose cell B14 and enter the VAR.S().
=VAR.S(B3:B12,C3:C12,D3:D12)
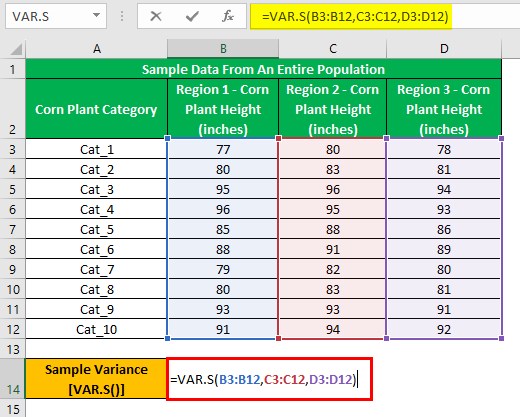
Step 2: Press Enter to execute the VAR.S Excel function in the target cell and achieve the required variance of the sample data, 39.63678161.
On the other hand, the following formulas show the different ways to supply the argument values to the VAR.S(), returning the same sample variance of 39.63678161.
=VAR.S(B3:D12)
Or
=VAR.S({77;80;95;96;85;88;79;80;93;91},{80;83;96;95;88;91;82;83;93;94},{78;81;94;93;86;89;80;81;91;92})
Or
=VAR.S(77,80,95,96,85,88,79,80,93,91,80,83,96,95,88,91,82,83,93,94,78,81,94,93,86,89,80,81,91,92)
Example #2
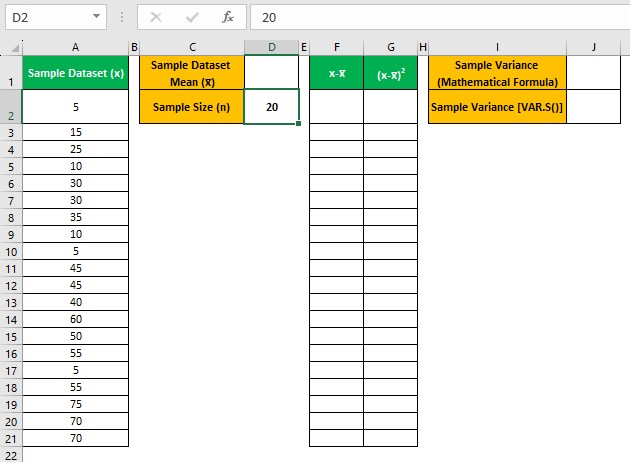
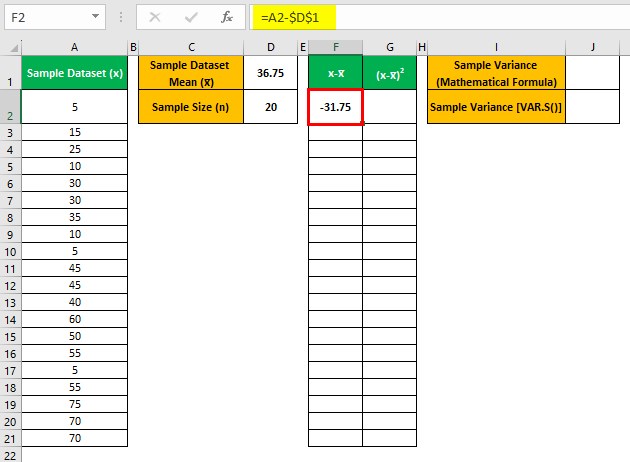
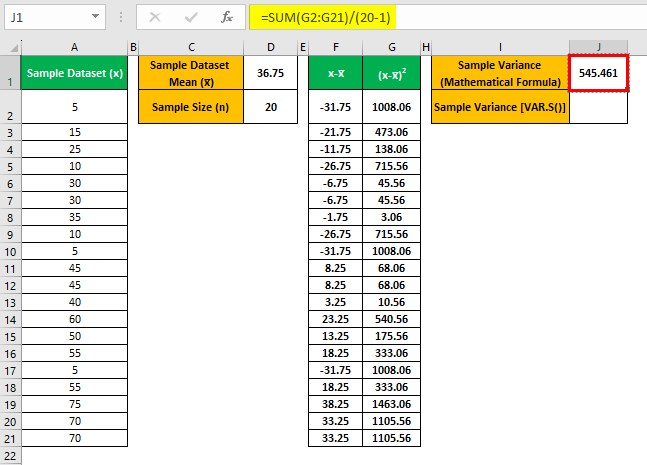
The following image shows a sample dataset of 20 data points from a population.
The sample variance’s mathematical formula is as follows:
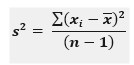
Where,
- s2: Sample Variance
- xi: The ith data point in the sample.
- x: Sample mean
- n: Sample size
We shall determine the sample variance based on the given sample using the mathematical formula and the VAR.S Excel function. Assume the target cells are J1:J2.
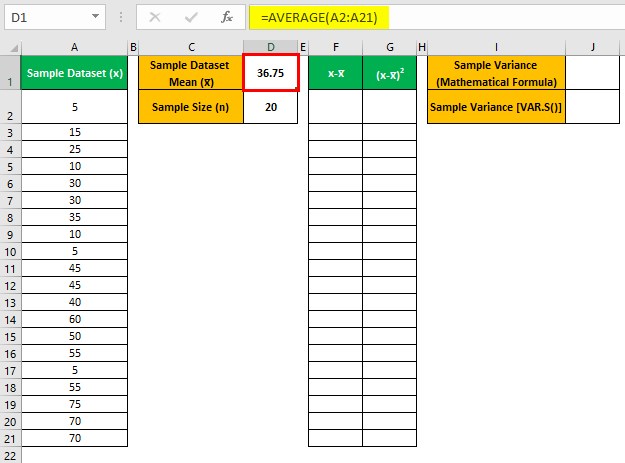
Step 1: Choose cell D1, enter the Excel AVERAGE function, and press Enter.
=AVERAGE(A2:A21)
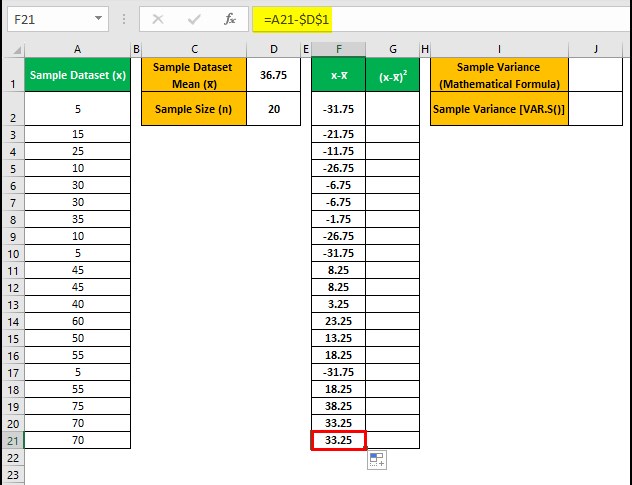
Step 2: Select cell F2, enter the following formula, and press Enter.
=A2-$D$1
Next, using the Excel fill handle, update the formula in the range F3:F21.
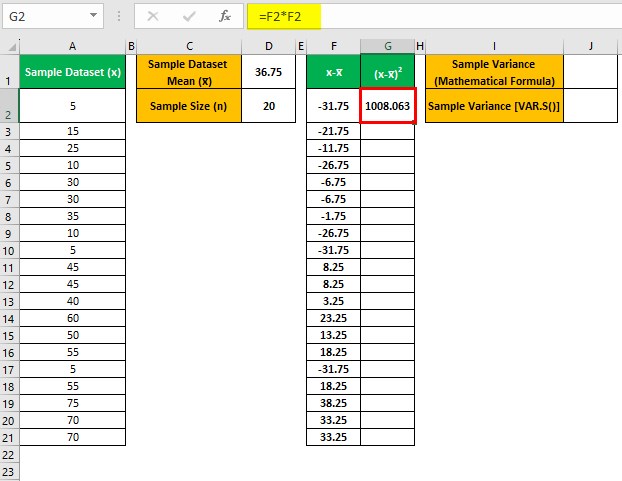
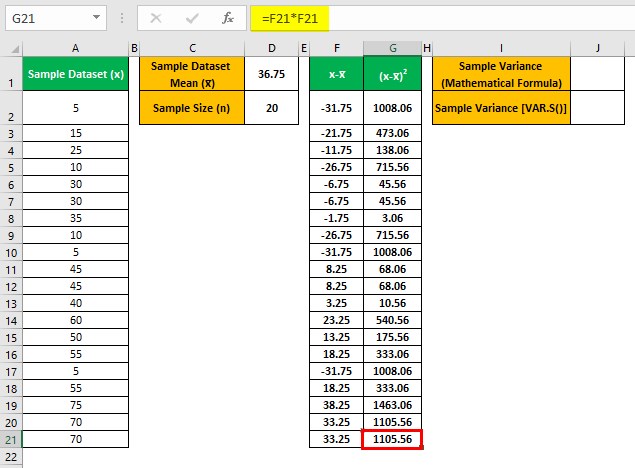
Step 3: Choose cell G2, enter the below formula, and press Enter.
=F2*F2
Next, using the Excel fill handle, update the formula in the range G3:G21.
Step 4: Select cell J1, enter the sample variance mathematical formula, and press Enter.
=SUM(G2:G21)/(20-1)
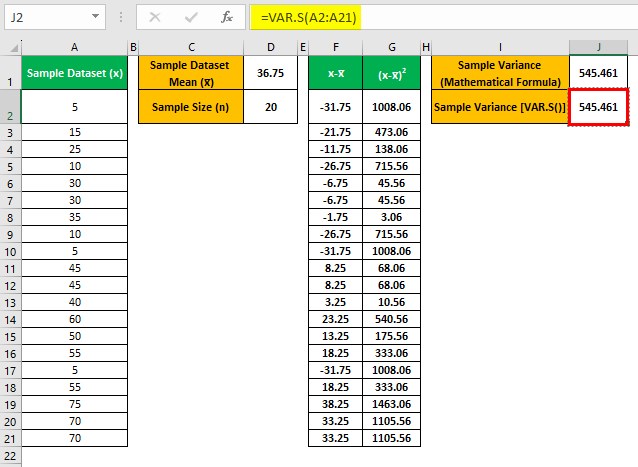
Step 5: Select cell J2, enter the sample variance Excel function, VAR.S(), and press Enter.
=VAR.S(A2:A21)
First, we determine the sample mean in cell D1 using AVERAGE(), with the given sample data range as the input. Thus, we obtain the sample mean as 36.75.
Next, we calculate the difference between each data point in the sample and the sample mean in the range F2:F21. After that, we find the square of the differences in the range G2:G21.
Finally, we add the square of the differences and divide the sum value by the sample size reduced by one in cell J1. The formula helps us obtain the required sample variance of 545.461 using the mathematical expression.
Furthermore, we apply the VAR.S(), with the given sample data range as the input, in cell J2 to calculate the required sample variance of 545.461.
Example #3
The following image shows a sample dataset containing a list of employees and their attendance data.
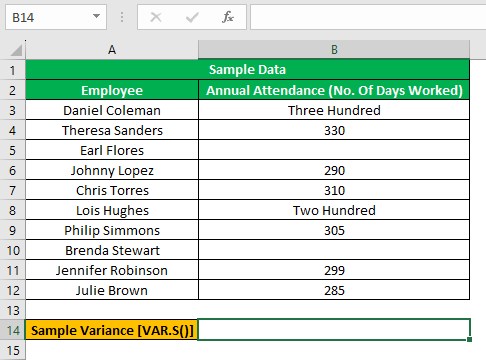
However, the attendance data contains text values and blank cells.
Let us see how the VAR.S Excel function works when the sample contains blanks and texts. Assume the target cell is B14.
Step 1: Choose cell B14, enter the VAR.S Excel function, and press Enter.
=VAR.S("Three Hundred",330,"",290,310,"Two Hundred",305,"",299,285)
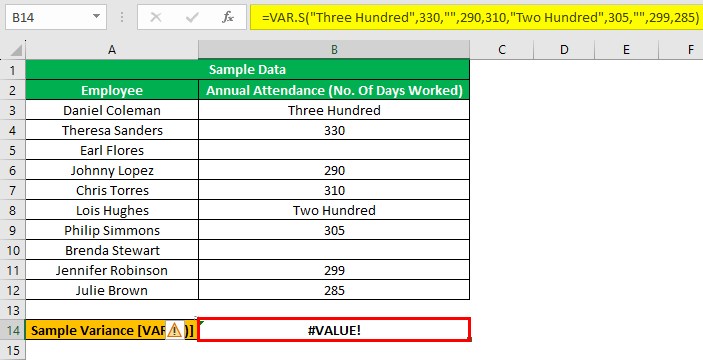
The above output shows that when we supply the sample data points directly as values to the VAR.S(), the function counts the blanks and text values. It thus leads to the function returning an error value.
So here is how we can overcome the error.
Step 2: Choose cell B14, enter the VAR.S(), and press Enter.
=VAR.S(B3:B12)
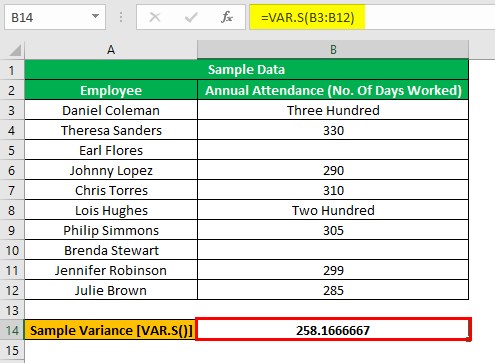
When we supply the sample data range reference as the argument value to the VAR.S(), the function ignores the blanks and the text values. It returns the required sample variance based on the numbers in the sample.
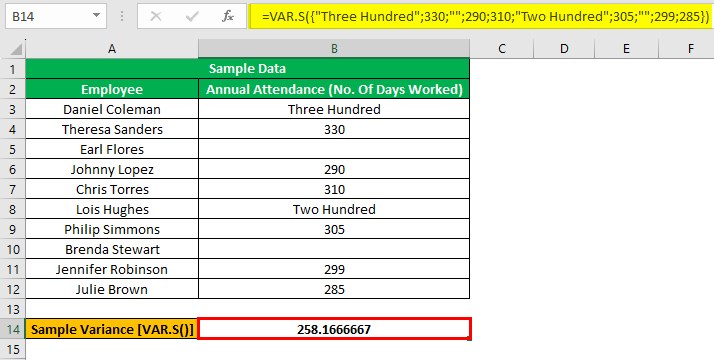
Furthermore, supplying the sample data points as array elements to the VAR.S() makes the function ignore the blanks and the text values. And we achieve the required sample variance.
=VAR.S({"Three Hundred";330;"";290;310;"Two Hundred";305;"";299;285})
Important Things To Note
- Ensure the sample supplied as input to the VAR.S Excel function contains at least two numeric data points. Otherwise, the function output will be the #DIV/0! error.
- The VAR.S function ignores texts, blanks, and logical values. However, if we supply them directly as argument values to the function, the function output will be the #VALUE! error.
- If the provided error values or texts to the VAR.S() do not convert into numbers, the function returns the #VALUE! error.
Frequently Asked Questions (FAQs)
The difference between VAR.P and VAR.S in Excel is that the VAR.P() determines an entire population’s variance. On the other hand, the VAR.S() returns the variance of a sample of the entire population.
For example, the following dataset lists athletes and their lap times in seconds.
The aim is to determine the deviation of the lap times from the average value based on the dataset considered as the entire population and as a sample of the entire population. Assume the target cells are E1:E2.
Step 1: Choose cell E1, enter the VAR.P(), and press Enter.
=VAR.P(B2:B11)
We use the VAR.P() in cell E1 since we consider the given data as the entire population and must determine the population variance.
Step 2: Choose cell E2, enter the VAR.S(), and press Enter.
=VAR.S(B2:B11)
We use the VAR.S() in cell E2 since we consider the given data as the sample of the entire population and must determine the sample variance.
The common mistakes while using VAR.S Excel are as follows:
• Using the VAR.S() to determine a type of variance other than the sample variance.
• Using the VAR.S() for a dataset containing only one data point.
The VAR.S isn’t working because of the following reasons:
• The sample contains less than two numeric data points.
• The applied VAR.S() has syntax errors, such as invalid cell references or missing parentheses.
• The data points supplied directly as values to the VAR.S() include texts, blanks, logical, and error values.
• The supplied error values or texts to the VAR.S() do not translate into numbers.
Download Template
This article must be helpful to understand the VAR.S Excel, with its formula and examples. You can download the template here to use it instantly.
Recommended Articles
This has been a guide to What Is VAR.S Excel. Here we explain the VAR.S function syntax and how to use it in Excel with examples and points to remember. You may learn more from the following articles -
