Table Of Contents
Upside Gap Two Crows Meaning
The upside gap two crow is a candlestick pattern that is widely used in technical analysis. Traders can identify and assess bearish trend reversals using it. This typically appears at the peak of an uptrend and is supported by market volume.
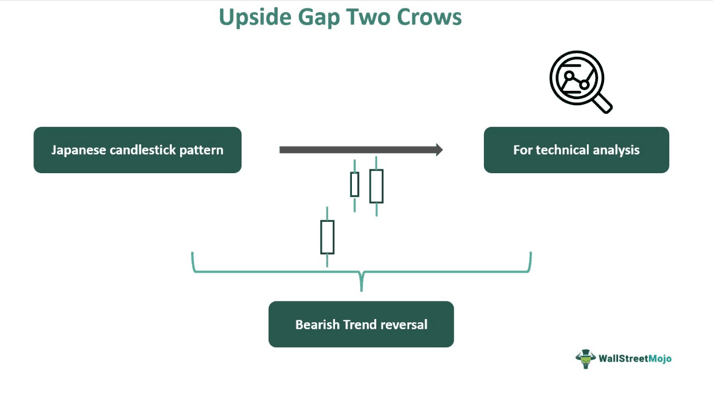
This is a Japanese candlestick pattern that involves three candles, each having its significance. This indicates that the strength of the market is about to decline, and there is every possibility of a down move. However, it is not very common for this pattern to appear in charts.
Key Takeaways
- Upside gap two crow is a candlestick arrangement that traders frequently use to spot downward trend reversal.
- This is a part of the technical analysis that identifies when at which point the market is about to make a bearish move after a significant uptrend.
- It is a set of three candles that appear at the end of an uptrend and is marked by volume to help in identification. Each candle has its part within the pattern.
- Though it is not common, this Japanese pattern denotes that the trader can either sell off or short a stock.
Upside Gap Two Crows Explained
Upside gap two crows refer to a form of candlestick pattern that appears in a chart during the technical analysis of any financial instrument. This Japanese pattern spots downside reversal from an ongoing uptrend and typically comes at the end of the uptrend.
It is a pattern made up of three consecutive trading sessions. The first candle appears as an uptrend candle. Then comes another small candle above the previous one, which means there is a gap between the first one and the second, followed by a big candle that engulfs the second one.
It is not difficult to spot the upside gap two crows candlestick pattern, especially if the traders are experienced in the market because it typically appears at the peak of an uptrend. However, they should also watch out for the trading volume since it provides crucial insight into the next possible market move.
However, this cannot be used as a standalone indicator and should be combined with other trend-changing and momentum indicators, which may be candlestick patterns or oscillators, which will give a better confirmation.
Formation
The formation of the candlestick arrangement is fascinating to note. Among the three candles, the first one will come at the end of the long uptrend session, which has a long and rising body. This comes with some gaps from the previous candle, which is usually a bullish candle with a closing price higher than its opening price.
After that, again, there is a small candle that opens with a gap up from the first one. This is a bearish candle that is small in size. The closing price is below the opening one.
After that, the third candle, which is thick, engulfs the second one. This is a strong, bearish candle, with its opening above the opening price of the second candle and closing below the closing price of the second candle. However, it should be noted that the closing price of the third candle should be above the close of the first candle. Thus, this explains the formation of the entire upside gap two crows candlestick pattern.
Interpretation
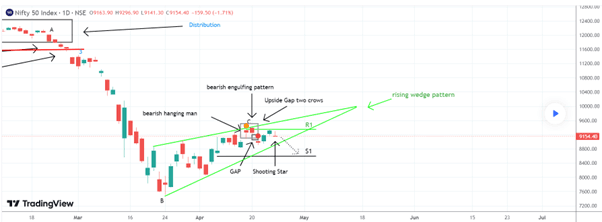
It is possible to gain a better understanding and insight into the concept with the help of a chart from TradingView, as given below. In the chart of Nifty 50, the pattern is clearly visible and marked with arrows. The first candle is a bullish one, followed by a small red bearish candle that opens at a gap from the previous one. Then comes another red bearish candle that totally engulfs the second candle.
It is easy to note that even though the third candle is a big one, it is above the first candle. This entire set forms an upside gap two crows pattern in the chart below. From here, it is possible to interpret that the strong uptrend going on pushes the market upwards, forming the first bullish candle of the pattern. The send candle is bearish but has a gap because the bulls are making a final effort to push the prices up but are not able to sustain them. So the final one is a significant bearish engulfing candle, where the bulls have lost their momentum.
Examples
A few examples will clarify the concept.
Example #1
Jake is a long-term investor who has been holding the stock of ABC Inc. He has noted that the stock has gone up to a considerable extent, and there is a chance that it will now show some downward movement. Sure enough, at the end of an uptrend, he notices an Upside Gap Two Crows pattern consisting of three candles starting with a bullish candle, then a small bearish gap up a candle, which has been engulfed with a big bearish candle, that is above the first bullish one. He decides to exit the stock with profit.
Example #2
Here is another example of Jenny, who is a long-term investor. She has kept a close watch on the stock of KKJ Paints, which has been trading upside for the last six months. However, due to the demand for the product being quite seasonal, currently the sales figures have come down. This has affected their revenue and profits, which, according to Jenny, should impact the stock prices to some extent. She spots three candles, a pattern for upside gap two crows, and takes a short position along with confirmation using other indicators. After one month, she covers her short position with profit.
Benefits
Here are some significant benefits of the concept.
- This pattern is not something that has taken place randomly. It signifies the possibility of a trend change in the downward direction.
- The traders can get a prior indication of the change in trend. Thus, it helps them keep a close eye on the market and take action accordingly to avoid losses.
- It acts as a warning sign to indicate that the uptrend is now losing strength.
- It is an excellent level to plan for exiting the market or going for a short strategy.
Limitations
Some limitations of the same are as follows:
- This cannot be used as a standalone indicator. It should be combined with other relevant indicators that will confirm that there will soon be a down move.
- It will not be effective without good trading volume for the stock.
- It does not guarantee any fall in price. Moreover, it also does not show how far the price may fall.
- For traders who use it to short the market, it is essential that they know about other indicators that will confirm the level at which they need to cover their short positions.
Upside Gap Two Crows Vs. Three Black Crows
The above two types of technical indicators are very closely related. But there are some significant differences, as given below:
- The former indicates the possibility of a downtrend, with the first being a bullish candle, followed by two bearish candles. But the latter shows all three bearish candlesticks.
- The former indicates that the bullish trend is slowly losing its strength or momentum. However, the latter indicates that the bullish trend has already lost momentum, and bears have taken over.
- The bearish trend reversal indication is weak in the case of the former and strong in the case of the latter.
For professional-grade stock and crypto charts, we recommend TradingView – one of the most trusted platforms among traders.
Disclosure: This article contains affiliate links. If you sign up through these links, we may earn a small commission at no extra cost to you.