Table Of Contents
What Is A Two-Sample T-Test?
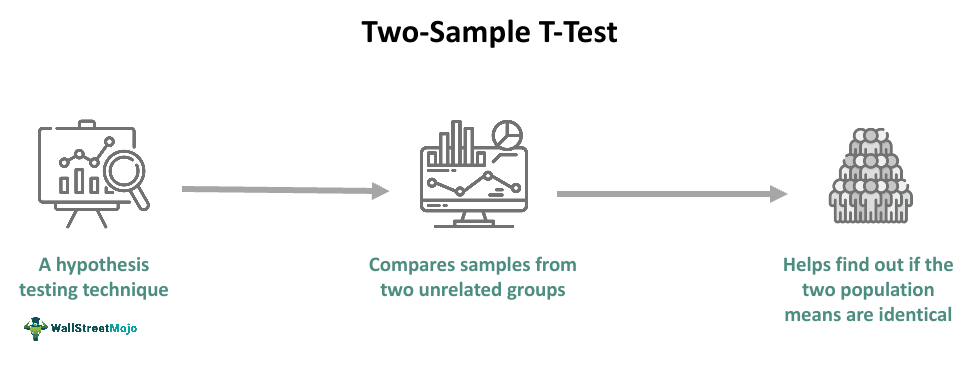
A two-sample t-test refers to a hypothesis testing method that involves comparing samples from a couple of independent groups. It helps in determining whether the associated populations’ means are significantly different. For example, it can help one know if a new procedure is better than the current procedure.
One can only utilize this technique when two samples’ data are randomly sampled from a couple of normal populations, are statistically independent, and both the independent groups have the exact variances. Since the two groups are independent, unrelated, or unpaired, such a test is also called an independent samples t-test. There are two-sample t-test types, which are equal and unequal variance.
Key Takeaways
- Two-sample T-test refers to a technique used in different fields like business and social sciences to test if two groups’ unknown population means are the same or not.
- Besides validating data findings between a couple of groups, this hypothesis testing method indicates the extent of compared differences.
- There are different two-sample t-test types — equal and unequal variance.
- Individuals can opt for a paired t-test when the data available to them is in matched pairs. On the other hand, people can use an independent samples t-test when there isn’t any statistical relationship between the two samples under consideration.
Two-Sample T-Test Explained
Two-sample t-tests refer to hypothesis testing techniques that one can use to conduct an analysis of the difference between a couple of unknown population means. In other words, people can use it if they take two samples from separate populations for comparison.
This type of test compares the means of a couple of groups and helps one understand if there is a significant difference between those two sample groups. It helps one answer questions, for example, if the rate of success is higher after executing a new sales tool.
The following key features of this hypothesis testing technique can help one understand the topic better:
- The two samples are independent. In other words, both samples cannot be from the same people’s group. Moreover, they must not have any kind of relation.
- A sample of less than 30 is a small sample. That said, one must note that there are no size-related restrictions for utilizing such a test.
- The standard deviations of populations subject to comparison are unknown.
- The quantity of data collected is less. Hence, data collection is a straightforward process. Also, because of this, calculation is easy.
- The normal distribution assumption provides the data with robustness.
Assumptions
Let us look at some key two-sample t-test assumptions.
- All observations are independent of every observation in another sample. In other words, the samples do not have any relation.
- Each of the populations has a normal distribution. This assumption is important, especially in the case of a small sample size. Normal distributions allow people to utilize the t-distribution, which forms the t-test’s basis.
- The variance of the two samples is approximately the same.
- From a statistical standpoint, measurements made on the identical objects group are independent.
- All observations within both samples are independently distributed and randomly selected.
- Another two-sample t-test assumption is that there is an identical or nearly identical sample size between two groups that are subject to testing.
Types
The different two-sample t-test types are as follows:
- Equal Variance: This refers to an independent t-test that one can utilize when all samples in each group are the same in terms of numbers or when the two sets of data are similar.
- Unequal Variance: Like the equal variance type, this one is an independent t-test that one can utilize when the total number of samples in each of the groups is not the same. Also, note that the two data sets’ variance is different in such a case.
One must remember that they must choose the type of t-test based on the research question they wish to answer and the nature of information or data available to them.
Formula
Let us look at the formula one can utilize to implement this technique.
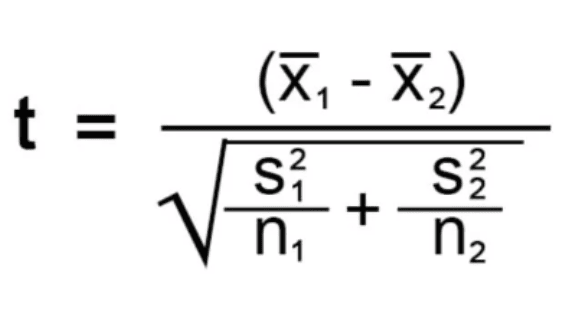
Where:
- X̅1 = First sample’s observed mean
- X̅2 = Second sample’s observed mean
- S1 = First sample’s standard deviation
- S2 = Second sample’s standard deviation
- n1 = First sample’s sample size
- n2 = Second sample’s sample size
- t = Test statistic
Examples
Let us look at a few two-sample t-test calculation examples to understand the concept better.
Example #1
Suppose Company ABC offers portfolio management services. It wants to compare the average returns of two different portfolios managed by it. While one portfolio consists of growth stocks, the other one comprises dividend stocks. The fund managers can utilize a two-sample t-test to determine whether there is any significant difference between the two offerings’ average returns. Based on the results obtained by using this technique, the company may make adjustments to its investment strategy.
Example #2
Suppose Company XYZ is testing a couple of different marketing strategies, for example, D and E, for a particular product offered by them to find out which strategy can generate higher revenue on average. In this case, the organization can conduct a two-sample t-test to compare the average revenue earned from the two strategies. If the test shows that the difference in the average sales is significant from a statistical standpoint, Company XYZ can decide to utilize a particular strategy on the basis of the results obtained.
To clearly understand, let us say -
The mean of the sales generated using Strategy A and B is 13.3 and 16.6, respectively.
Next, suppose the standard deviation of the two groups is 2.0586 and 1.9880, respectively.
Thus, we can use the two-sample t-test formula to compute the test statistic.
In this case, the t-test value will be -.39945.
This shows that the difference in the average sales when using different strategies is significant. Hence, the company can choose the strategy that produces the best results.
Applications
Let us look at some real-world applications of independent samples t-tests.
#1 - Finance And Business
- It enables organizations to compare two products’ sales performance.
- This technique enables businesses to analyze two marketing strategies’ effectiveness.
#2 - Social Sciences
- The method allows one to analyze the differences concerning academic performances between a couple of educational institutions.
- It can enable one to compare the mean happiness levels among a couple of age groups.
#3 - Medicine And Healthcare
- It can enable people to carry out a comparison of two patient groups’ mean blood pressure levels.
- The hypothesis testing method helps in examining the impact of a couple of treatments on patient outcomes.
Two-Sample T-Test vs Paired T-Test
The concepts of two-sample and paired t-tests can be confusing for individuals new to the world of finance. To develop a comprehensive understanding of their meaning and purpose, one needs to understand how they are different from one another. In that regard, one must look at their distinct characteristics. Hence, let us look at them.
| Two-Sample T-Test | Paired T-Test |
|---|---|
| One can utilize this technique when the two samples’ data have no statistical relation. | Individuals can opt for this method when the data available to them is in matched pairs. In other words, in this case, one can pair the observations in a sample with observations with the observations of the other sample. |
| In this case, one needs to assume that data from both samples have the exact variances and are subject to | For paired t-tests, one must assume that the normal distribution of only each pair takes place. |
