Table Of Contents
What Is Triangle Chart Pattern?
Triangle chart patterns are usually identified by traders when a financial instrument’s trading range narrows after a downtrend or an uptrend. These chart patterns can indicate a trend reversal or signal the continuation of a bearish or bullish market. Thus, traders can use them to take crucial buy-and-sell decisions.

Triangles represent a fall in volatility that could increase after some time. They offer analytical insights into the current conditions and provide indications of the different types of imminent conditions. Moreover, these chart patterns offer trading opportunities while their formation occurs and after completion. There are three types of triangle chart patterns — descending, ascending, and symmetrical.
Table of contents
- What Is Triangle Chart Pattern?
- A triangle chart pattern in technical analysis is formed by drawing upper and lower trendlines that converge as the asset’s price temporarily moves sideways. This chart pattern helps indicate the continuation of a bearish or bullish trend. That said, it also signals a trend reversal.
- Symmetrical, descending, and ascending are the different types of triangle chart patterns that traders can use to generate returns and achieve their financial objectives.
- The ascending triangle is a bullish chart pattern, while the descending triangle is a bearish chart pattern.
Triangle Chart Pattern Explained
A triangle chart pattern forms when the trading range of a financial instrument, for example, a stock, narrows following a downtrend or an uptrend. Such a chart pattern can indicate a trend reversal or the continuation of a trend.
Connecting the upper trendline’s starting point to the lower trendline’s start leads to the formation of the triangle. Individuals can form the upper trendline by joining the highs. On the other hand, they can connect the lows to form the lower trendline.
Triangle patterns are like pennants and wedges and can be a powerful reversal or continuation pattern. Technical analysts consider a failure or a breakout of this kind of pattern, particularly on high volume, as strong bearish/bullish signals of a reversal or resumption of the previous trend.
Types
As noted above, triangle chart patterns are of three types. Let us look at each of them in detail.
#1 - Symmetrical Triangle
The formation of a symmetrical triangle chart pattern occurs when a financial instrument’s upward and downward price movements are restricted to an increasingly smaller area with time. In other words, an upward movement is not as high as the previous upward movement, and a downward movement is not as low as the previous downward movement. As a result, such price movements create lower swing lows and lower swing highs.
Connecting swing lows and highs with two separate trendlines creates a symmetrical triangle chart pattern where both trendlines move toward each other. Individuals can draw a trend line after they connect two swing lows and a couple of swing highs using a trendline. Since an asset’s price may rise or fall in the form of a triangle multiple times, in many cases, traders wait for the formation of three swing lows or highs before drawing trendlines.
#2 - Ascending Triangle
The formation of a bullish triangle chart pattern occurs when an asset’s price crosses the upper trendline with increasing volume. However, one must note that the upper trendline must be horizontal, indicating almost identical highs, which establish a resistance level.
The lower trendline rises diagonally. This indicates higher lows as the buyers in the market patiently increase their bids. That said, eventually, they no longer remain patient and rush into the financial instrument above the resistance level. This leads to more traders buying the asset as the uptrend starts again.
#3 - Descending Triangle
This pattern is an ascending triangle’s inverted version. In this case, the lower trendline must be horizontal and connect the almost identical lows. However, the upper trendline falls diagonally in the direction of the apex.
One must note that the breakdown materializes when the asset’s price drops through the lower trendline as the downward trend starts again. The lower trendline, which was previously the support, becomes resistance.
How To Trade?
Let us discuss how one can trade the above triangle patterns in detail.
#1 - Trading The Symmetrical Triangle Patterns
Market analysts and traders often consider symmetrical triangles consolidation patterns. Such patterns may indicate a trend reversal or a continuation of the prevailing trend. The formation of this pattern occurs as slowly the descending resistance lines and the ascending support lines meet up and the financial instrument’s trading range progressively smaller.

Generally, an asset’s price rises and falls, remaining between the upper and lower trendlines and moving toward the triangle’s apex. Eventually, the price breaks out in any direction (up or down) and forms a sustained trend.
When a symmetrical triangle pattern appears after a bullish trend, one must seek a breakout beneath the rising support line. This would give the indication of a market reversal. In other words, it would indicate a downtrend.
Typically, a breakout from such a triangle strongly indicates the future trend direction. Also, the formation of a symmetrical triangle makes it easier for individuals to spot rational stop loss levels — above the triangle’s high when short selling and below the triangle’s low when buying.
#2 - Trading The Ascending Triangle Pattern
Since an ascending triangle is a bullish pattern, it is crucial to observe the ascension line as it signals that the bears are slowly exiting the market. After that, the buyers or bulls can push the security prices beyond the resistance level signaled by the triangle’s flat top line.

Traders must be careful about making buy-and-sell decisions before the prices breach the resistance line, as the pattern may not fully form or a move to the downside may violate it. They can lower the risk by waiting until the conforming breakout materializes. Once buyers confirm the breakout, they can rationally place stop-loss orders beneath the triangle pattern’s low.
#3 - Trading The Descending Triangle Pattern
A descending triangle is the opposite of an ascending one. This is a bearish triangle chart pattern that indicates that a financial instrument’s price keeps falling as the pattern completes itself. Similar to the other triangles, two trendlines establish the pattern. However, the supporting line here is flat, whereas the resistance line is downward-sloping.
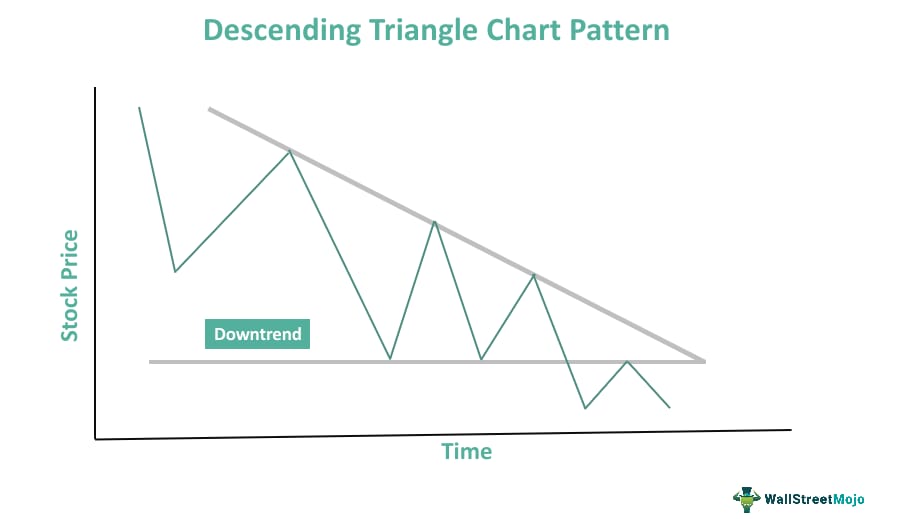
If the descending triangle pattern forms during an uptrend continuing over a long period, it indicates that a trend change or a market reversal is likely. This triangle develops when an asset’s price decreases but rises again, bouncing off the bottom trendline. That said, every attempt to push asset prices higher becomes less successful than the previous attempt. Eventually, the bears or sellers gain control; they push the asset prices beneath the supporting trendline. This confirms the triangle’s signal that asset prices are falling lower.
One must note that sellers can opt for short selling when the downside breakout materializes. However, they must place a stop-loss at a level just over the highest price recorded during the triangle’s formation.
Chart
Let us look at this Naga Dhunseri Group Limited price chart to understand the triangle pattern better.

The above chart represents an ascending triangle pattern. Its formation takes place after the security’s price crosses the horizontal trend line. Note that an increased trading volume accompanies this bullish formation, as shown in the chart. The upper trend line signals almost the exact highs, forming a level of resistance.
That said, one can notice that the lower trend line rises diagonally, giving the indication of higher lows as the bulls in the market patiently increase their bids. Eventually, buyers in the market lose their patience and start purchasing the stock above the level of resistance. This leads to more buying and the upward trend’s continuation. Once the breakout occurs and the confirmation of the same takes place, the upper trend line serves as the support line.
If people want to look at more of such patterns to improve their understanding of this concept, they can go to the official website of TradingView.
Examples
Let us look at a few triangle chart pattern examples to understand the concept better.
Example #1
Godrej Consumer Products bucked the trend and recorded a 52-week high of ₹963 on March 20, 2023. This stock provided a breakout over the symmetrical triangle chart pattern on weekly charts, which is a bullish signal. The breakout area was above ₹900, and the stock had significant support around such levels.
That said, a close below ₹900 could result in a trend reversal. Hence, experts recommended buying the stock then or taking advantage of the buy-the-dip opportunity towards ₹930 with a target price of ₹1,000.
Example #2
Suppose ABC stock is on an uptrend for a long period. Matt Smith, a trader, noticed the formation of a triangle chart pattern after the asset’s price fell and then jumped again, bouncing off the lower trendline. So, he decided to enter a short position. His move turned out to be the right one as the bears gained control and pushed the price of ABC stock downward. As a result, Matt was able to earn significant gains.
For professional-grade stock and crypto charts, we recommend TradingView – one of the most trusted platforms among traders.
Disclosure: This article contains affiliate links. If you sign up through these links, we may earn a small commission at no extra cost to you.

Frequently Asked Questions (FAQs)
Generally, the price target for this pattern is equivalent to the difference between the entry price and the vertical height between the upper and lower trendlines when the breakdown occurs.
According to LinkedIn, the success rate of descending and ascending triangle patterns is 72.93% and 72.77%, respectively.
Traders must remember that the longer the duration for which a triangle pattern appears, the more the potency of the target. For example, one must respect the weekly ascending triangle pattern’s target more than the target of a daily ascending triangle pattern.
Ascending triangles are a bullish signal; they indicate an upside breakout. On the other hand, descending triangles are bearish formations, signaling a downside breakout. Traders must note that in the case of symmetrical triangles, the price action grows progressively narrow. Such a pattern may result in an upside or a downside breakout.
Recommended Articles
This article has been a guide to what is Triangle Chart Pattern. Here, we explain it with its types, examples, and how to trade it. You may also find some useful articles here -
