Table Of Contents
Differences between Trailing PE vs. Forward PE Ratio
Trailing PE uses earnings per share of the company over the previous 12 months for calculating the price-earnings ratio. In contrast, Forward PE uses the forecasted earnings per share of the company over the next 12 months for calculating the price-earnings ratio.

Trailing PE vs Forward PE Ratio Explained in Video
What is Trailing PE Ratio
Trailing PE Ratio is where we use the Historical Earning Per share in the denominator.
Trailing PE Ratio Formula (TTM or Trailing Twelve Months) = Price Per Share / EPS over the previous 12 months.
Trailing PE vs. Forward PE Ratio
Trailing PE Ratio Example
Let us calculate the Trailing PE Ratio of Amazon.
Amazon Current Share Price = 1,586.51 (as of 20th March, 2018)

source: reuters.com
- Earnings Per Share (TTM) of Amazon = EPS (Dec,2017) + EPS (Sep 2017) + EPS (June 2017) + EPS (March, 2017) = 2.153 + 0.518 + 0.400 + 1.505 = $4.576
- PE (TTM) = Current Price / EPS (TTM) = 1586.51 / 4.576 = 346.7x
What is Forward PE Ratio
Let us now look at how to calculate Forward PE Ratio using Formula -
Forward PE Ratio Formula = Price Per Share / Forecasted EPS over the next 12 months
Forward PE Ratio Example
Amazon Current Share Price = 1,586.51 (as of 20th March 2018)

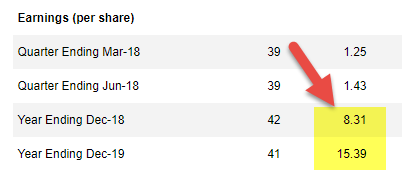
Forward EPS (2018) of Amazon = $8.31
Forward EPS (2019) of Amazon = $15.39
- Forward PE Ratio (2018) = Current Price / EPS (2018) = 1,586.51/8.31 = 190.91x
- Forward PE Ratio (2019) = Current Price / EPS (2019) = 1,586.51/15.39 = 103.08x
Trailing PE vs Forward PE Ratio (Important points to note)
Some things to consider regarding the Trailing Price Earning Ratio vs. Forward Price Earning Ratio.
- If EPS is expected to grow, the Forward PE Ratio will be lower than the Historical or Trailing PE. From the above table, AAA and BBB show an increase in EPS, and hence, their Forward PE Ratio is lower than the Trailing PE Ratio.
- On the other hand, if EPS is expected to decrease, you will note that the Forward PE Ratio will be higher than the Trailing PE Ratio. It can be observed in Company DDD, whose Trailing PE Ratio was at 23.0x; however, Forward PE Ratio increased to 28.7x and 38.3x in 2016 and 2017, respectively,
- Please note that the Forward PE Ratio only factors forecast EPS (2016E, 2017E, and so on), whereas the stock price will reflect earnings growth prospects far into the future.
- One should not only compare the Trailing PE Ratio for valuation comparison between the two companies but also look at the Forward PE Ratio to focus on Relative Value – whether the PE differences reflect the company’s long-term growth prospects and financial stability.
Trailing and Forward Price Earning Ratio - Quick Question
Rudy Comp reported $32million in earnings during FY2015. An analyst forecasts an EPS over the next twelve months of $1.2. Rudy has 25 million shares outstanding at a $20/share market price. Calculate Rudy’s trailing and leading P/E ratio. If the five-year historical average Price Earning Ratio is 15x, is Rudy Comp overvalued or undervalued?
Answer - Please drop your answers in the comment box.

