Table Of Contents
What Are Trading Multiples?
Sometimes, all the values essential for a discounted cash flow valuation will not be available when a company is being valued. Hence, the analyst must take a comparative company, find out the multiple financial values, and use them in our analysis to find the proper metric called trading multiples.

Also, have a look at this article - comparable company analysis.
Key Takeaways
- Trading multiples play a pivotal role in assessing firms. In cases where comprehensive data for discounted cash flow analysis is lacking, analysts resort to trading multiples based on comparable firms with diverse financial metrics.
- While trading multiples offers insights, reliance on numerous metrics can be misleading. It is crucial to seek trading multiples that project future scenarios rather than relying solely on historical data.
- The P/E ratio's utility is hampered by capital structure considerations and overall earnings computation, which incorporates non-operating expenses. As a result, alternative valuation methods might be more appropriate.
Example
You're comparing two companies – Company Y and Company Z. As an investor, you only know the share price, the number of shares outstanding for each company, and the market capitalization.
- Comparing the share price of Company Y ($10 per share) and Company Z ($25 per share), you don’t understand anything. How would you tell which company is doing great by looking at the share price?
That’s why you would look for relative value by using trading multiples.
- First, you see each company's earnings per share (EPS). You found out that the EPS of Company Y is $5 per share, and the EPS of Company Z is $9 per share. By looking at EPS, you conclude that Company Z is making more money than Company Y., But that doesn't mean it benefits you.
- To find out how much you would get out of the company shares, if you would buy them in the first place, you need to look at the price-earnings ratio. By looking at the P/E Ratio, you found out that for Company Y, it’s 1.5, and for Company Z, it’s 6.
- Now it becomes clear which company is more profitable for you as an investor. You would get a dollar worth of earnings by paying $1.50 to Company Y. In contrast, you would get a dollar worth of earnings by paying $6 to Company Z. That means Company Y is certainly more beneficial for you as an investor.
Trading Multiples - Video Explanation
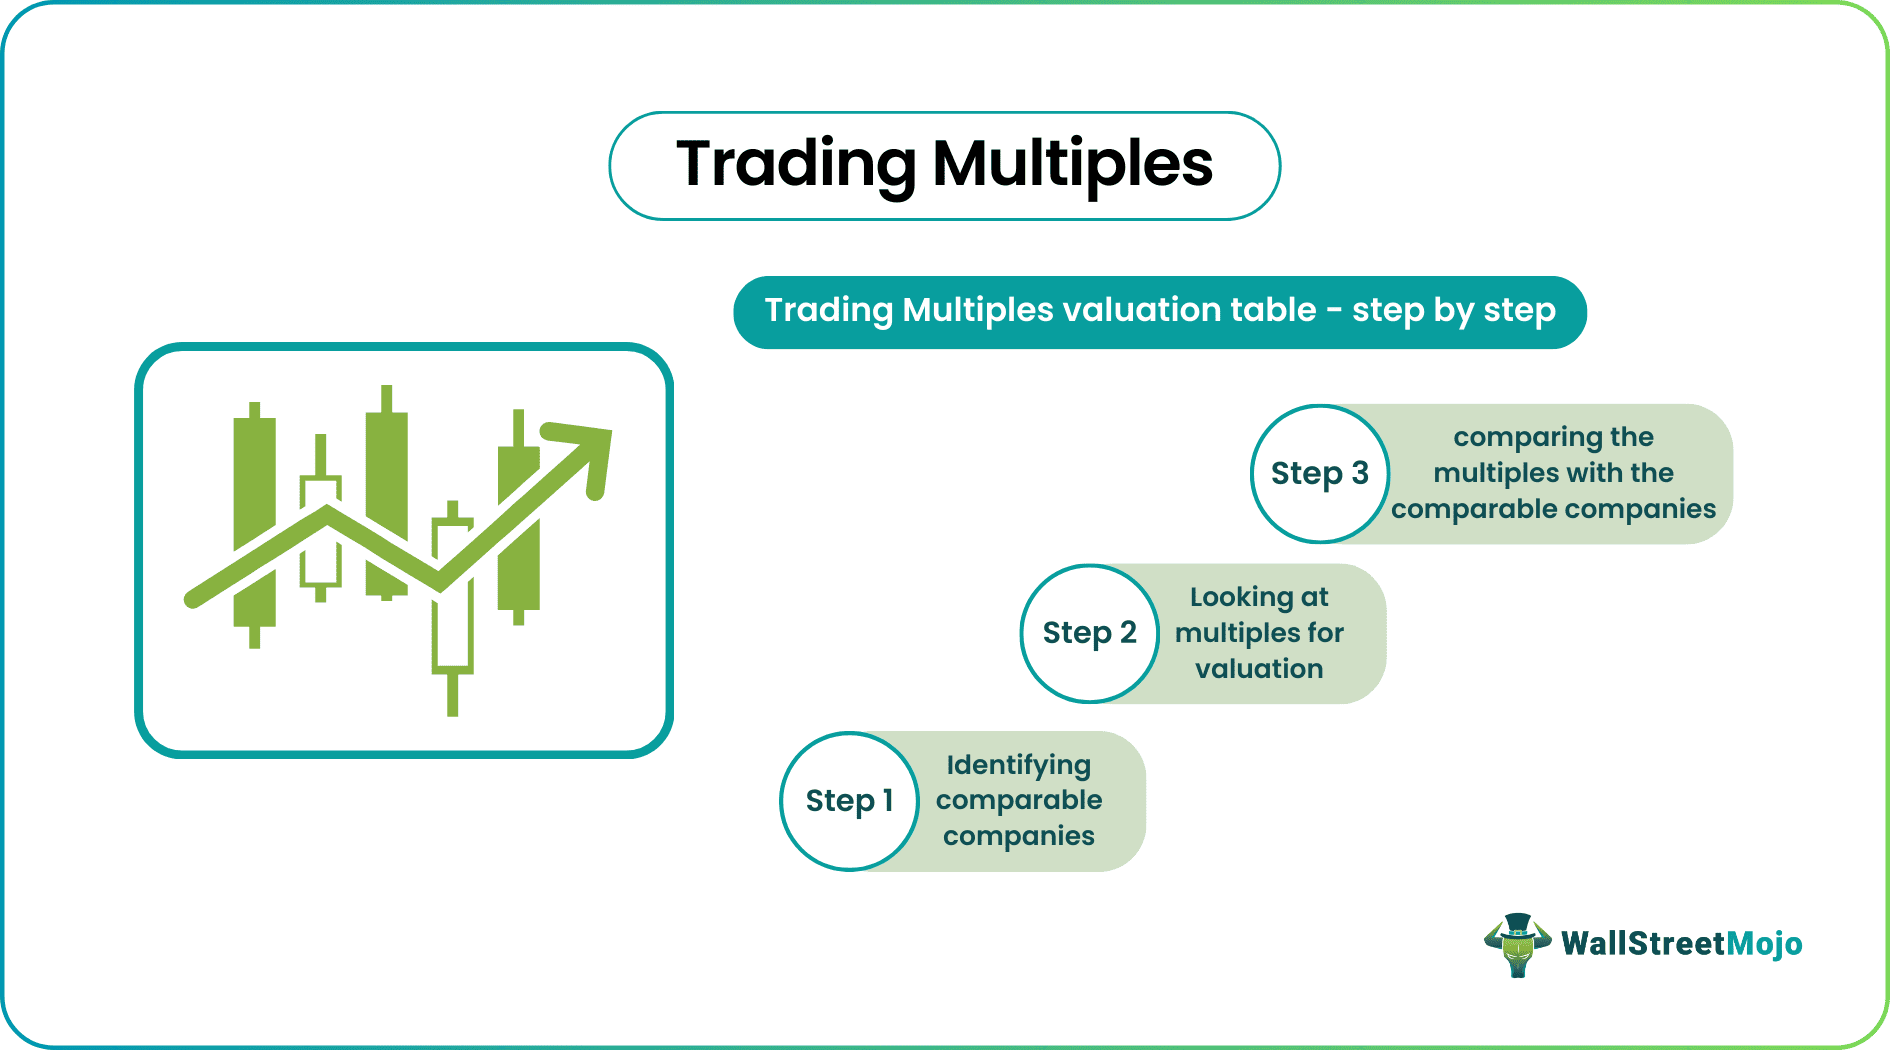
Trading Multiple Valuation Table - Step by Step
In this section, we will go step by step. We will talk about each step briefly. After going through the whole section, you would get a clear idea of using trading multiples for valuing a company.
Let's get started.
Step#1: Identifying Comparable Companies
Below is the comparable company analysis when I analyzed Box IPO.

The first question the investors ask – is how would we identify the comparable companies? The question is obvious. Since there are many companies in the industry, how would one know the right companies?
- First, you need to look for the business mix. Under the business mix, you would see three things – products and services offered by the companies, the geographical location of those companies, and the type of customers they serve.
- Second, you would see the size of the companies. Under the size, you can choose any or all three of the determinants – revenues of these companies, total assets under management, and EBITDA margins of these companies.
The idea is to find out the right industry, services/products, and trading multiples.
Additionally, as we see above in Box IPO comparable company analysis, we have also included Market capitalization and Enterprise Value. We do that because we do not want to compare a small-cap company with a large-cap company, as their valuation may differ due to different growth paths.
Step#2: Looking at Multiples for Valuations

As you already know, we can use various multiples for valuing a company. Here, we will talk about the most used and popular trading multiples.
- EV/EBITDA: This is one of the most common trading multiples. EV/EBITDA is a reliable multiple investors/analysts use to value a company. The purpose of using this is EV (Enterprise Value) considers the market capitalization and takes the debt into account. Even EBITDA also takes debt into account and not direct cash items. In usual scenarios, the right range for EV/EBITDA calculation is 6X to 15X.

Image Source: Financial Modeling and Valuation Course Bundle
- EV/Revenue: This is also another common multiple used a lot. This multiple applies to those situations where the EBITDA of a company is negative. If EBITDA is negative, EV/EBITDA wouldn’t be useful. And for companies that have just started their journey, a negative EBITDA is way too common. However, EV/Revenue isn’t a great multiple when two companies have similar revenues but can be pretty different in how they operate. When looking for EV/Revenue multiple, 1X to 3X is the right range.
- P/E Ratio: This is another common multiple that investors use to determine the price they need to pay for earning a dollar. It is almost similar to equity value to net income. The usual range of the P/E Ratio is 12X to 30X.
- EV/EBIT: This multiple is useful because EBIT is calculated after adjusting the depreciation and amortization. That means EBIT reflects the wear and tear of the company’s assets, and as a result, EBIT shows you the real income. EBIT and EBITDA are close enough, but as EBIT is less than EBITDA, the EV/EBIT multiple ranges would be higher, i.e., 10X to 20X.

Image Source: Valuation Course
Choosing an appropriate valuation tool is the key to successfully valuing the company. For the BOX IPO Comparable company analysis, we have included EV. Revenue, EV to EBITDA, and Price to cash flow multiple to value the firm. Ideally, we should show one year of historical multiple and two years of forwarding multiples (estimated).
Step#3: Comparing the Multiples with the Comparable Companies
It is the last step of the whole process. In this stage, you will look at various multiples of the target company and compare it with the comparable companies.

As we note from the above table, the general metrics are the simple mean, median, low, and high. If a company's multiple (in this case, Box) is above the mean/median, we infer that the company may be overvalued. On the other hand, if the multiple is below the mean/median, we may infer that it is undervalued. High and Low also help us understand the outliers and a case to remove those if they are too far away from the Mean/Median.
We can infer the following from the above table –
- Cloud companies are trading at an average of 9.5x EV/Sales Multiple.
- We note companies like Xero are an outlier that trades at 44x EV/Sales multiple (expected 2014 growth rate of 94%).
- The lowest EV/Sales multiple is 2.0x
- Cloud companies trade at an EV/EBITDA multiple of 32x.
Box IPO Valuation Using Trading Multiples
- From the financial model of Box, we note that Box is EBITDA Negative, so we can’t proceed with EV/EBITDA as a valuation tool. The only multiple that is suitable for valuation is EV/Sales.
- Since the median EV/Sales is around 7.7x, and the mean is around 9.5x, we may consider making three scenarios for valuations.
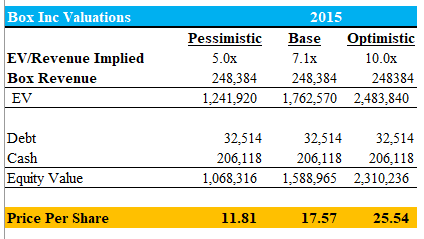
- Optimistic case of 10.0x EV/Sales, Base Case of 7.1x EV/Sales, and Pessimistic Case of 5.0x EV/Sales.
The below table shows the per-share price using the three scenarios.

- Box Inc valuation range from $15.65 (pessimistic case) to $29.38 (optimistic case)
- The most expected valuation for Box Inc using Relative Valuation is $21.40 (expected)
Things To Note
- Trading Multiple Valuations is nothing but identifying comparable companies and performing relative valuations like an expert to find the firm's fair value.
- The trading multiple valuation processes start with identifying the comparable companies, then selecting the right valuation tools, and finally preparing a table that can provide easy inferences about the fair valuation of the industry and the company.
- Many trading multiples can mislead you. It’s better to look for forward-looking trading multiples instead of only looking at the past data.
- EV/EBITDA multiple is one of the best to use when comparing the target company with big companies. For start-ups, one of the best multiples is EV/Revenue.
- P/E Ratio shouldn’t be used at all. There are two reasons behind it. First of all, the P/E Ratio is mostly affected by the capital structure. Secondly, the P/E ratio is calculated by taking the overall earnings. Overall earnings include many non-operating charges like write-offs, restructuring charges, etc.
For professional-grade stock and crypto charts, we recommend TradingView – one of the most trusted platforms among traders.
Disclosure: This article contains affiliate links. If you sign up through these links, we may earn a small commission at no extra cost to you.

