Table Of Contents
Time Series Definition
Time series refers to a chain of data points observed and recorded in a time order over a specific period. It represents the output obtained from monitoring and tracking specific events or processes.
A time series is recorded at specific time intervals. These intervals may be hourly, daily, monthly, or annually, and depends on the scenario. It is commonly used in areas such as finance, economics, weather forecasting, and sales analysis.
It is also known as time-stamped data and plays a major role in analysis and forecasting processes. It involves noting measurements at equally spaced time intervals. Its construction helps academics study how a variable changes over time. For instance, it can be applied to study the price movements of a security over time.
Key Takeaways
- A time series is a sequence of data points that are recorded at specific time intervals. Analysis of time series analysis is very helpful in understanding data that changes over time.
- Its main use is for forecasting sales, monitoring financial markets, or detecting failures in systems. The techniques used help obtain meaningful insights from time-ordered data.
- By breaking down the data into components, and choosing the right model, analysts can make informed and accurate predictions.
Time Series Explained
Time series contains observation in the numerical form that is represented in a chronological order. Analysis of this observed data and applying it as input to derive possible future developments was popularized in the late 20th century. It was primarily due to the textbook on time series analysis written by George E.P. Box and Gwilym M. Jenkins. They introduced the procedure to develop forecasts using the input based on the data points in the order of time, famously known as Box-Jenkins Analysis.
The key feature of the time series data is its chronological order. Here, each observation depends on the previous values. Thus, the time series analysis is different from other types of data analysis,
It can be categorized into different types; one is the categorization into non-stationary and stationary time series.
If stationary, it has stochastic properties like variance unvarying with time.
Whereas for non-stationary, its properties vary with time, and it can be a trend, random occurrences, seasons, cycles, etc. It is easy and effective to model when it is stationary by applying statistical modeling methods.
Various programming languages are used in the data analysis process involving time-dependent data. For example, its analysis with Python and R programming. It can also check if the data presented is stationary or non-stationary, and time-series databases are good for working on time-dependent data.
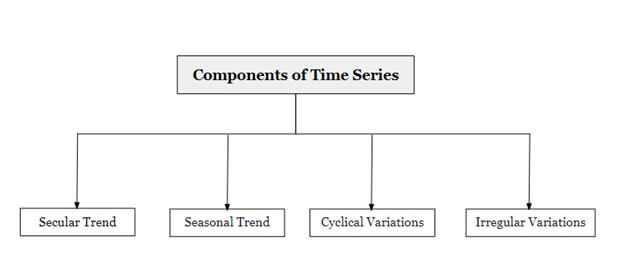
Components of Time Series

#1 - Secular Trend
It indicates the long-running pattern identified from the chain of data recorded. It can be increasing or decreasing, indicating the future direction. Although it is commonly known as an average tendency of any aspect, the trend may vary in specific parts oscillating between upward and downward. Still, the overall trend will depict a single movement only, either upward or downward.
For example, in summer, the temperature may rise or decline in a day, but the overall trend during the first two months will show how the heat has been rising from the beginning.
#2 - Seasonal Trend
Seasonal variations represent the presence of rhythmic patterns. Certain patterns repeatedly occur at the same period or point every year. For example, the sale of umbrellas increases during the rainy season, and air conditioners increase during summer.
Apart from natural occurrences, man-made conventions like fashion, marriage season, festivals, etc., play a key role in contributing to seasonal trends.
#3 - Cyclical Variations
It represents a cyclical pattern composed of up and down movement. It may span more than one year and go from phase to phase to complete a cycle. A business cycle is a significant example of a cyclic variation, denoted that a business goes through four stages in its life. Starting from the introduction, expansion, prosperity, and decline, it shows how well the company can perform and stretch its phases and depends on its performance.
#4 - Irregular Variations
It refers to variations that are uncontrollable and inevitable. It occurs randomly, opposite to regular changes or occurrences, and does not associate with a pattern. These fluctuations are unpredictable and unexplainable.
Forces like natural and man-made disasters can trigger irregular variations.
Time Series Analysis
- Time series analysis involves the study of time-stamped data to derive meaningful statistics that support informed decision-making.
- It helps in identifying and interpreting trends and patterns over time.
- Applications include prediction, classification, segmentation, descriptive analysis, and intervention analysis.
- Time series analysis is often applied to non-stationary data to observe how variables change over a period.
- Common examples include stock market analysis, forex historical data, sales and inventory tracking, and weather forecasting.
- Professionals in fields such as retail, financial market, sales, and meteorology benefit greatly from expertise in time series analysis.
Forecasting
Time series forecasting means assessing the time-stamped data using statistical calculations and modeling to make predictions and induce strong strategic decision-making. The process is widely adopted in many sectors, for example, sales forecasting and weather forecasting. Forecasting highly depends on the nature of the data, and the process is usually performed on historical data. The more simplified it is, the more accurate the forecasting becomes.
The model does have its limitations as it does not guarantee accuracy and may vary from the actual outcome. However, the analysts have some operating authority over models to regulate such constraints.
