Table Of Contents
What Is A Test Statistic?
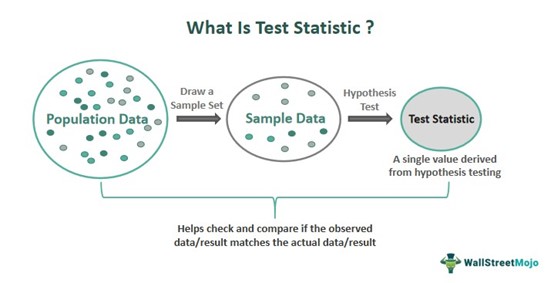
A Test Statistic is a random variable derived from sample data during hypothesis testing. It serves as a valuable component in deciding whether to reject or accept a null hypothesis by examining and comparing the observed results with the desired outcome. It allows investors to check and compare the average returns against the obtained observed or predicted value.
The test statistic simplifies the observed data into one random value to establish a correlation or pattern between the variables. Finding the p-value ascertains the probability of the hypothesis being valid. This tool is used in businesses to devise marketing strategies, in medical science for clinical trials, and politics for analyzing election polling data.
Key Takeaways
- A test statistic is a numerical value computed from the sample data to evaluate the intensity of the null hypothesis' rejection or acceptance during a hypothesis test.
- It provides a test result's p-value for comparing and validating the hypothesis with the actual outcome.
- The various statistical tests performed to evaluate the test statistic are z-test, t-test, chi-square, F-statistic, correlation coefficient, and regression coefficient.
- The two well-known formulae are, z = (x - μ) / (σ / √n) and t = (x - μ) / (s / √n), where x is the sample mean, μ is the population means, σ is standard deviation and n is the sample size.
Test Statistic Explained
A test statistic is a value acquired after the hypothesis test on the sample data representing the entire population. The process of hypothesis testing starts with a null hypothesis (H0), which serves as the default or baseline assumption. Subsequently, a sample of data is collected, and a test statistic is computed based on this information. The statistical measure quantifies the deviation of the observed data from the expected value under the null hypothesis.
The selection of a specific statistical metric depends on the particular hypothesis test being performed. Once the statistical metric is computed, it is compared to either a critical value or a p-value to make a decision. The desired significance level and the test statistic distribution under the null hypothesis gauge the critical value.
Hence, if it lies in the rejection region (beyond the critical value), the null hypothesis is dismissed in favor of the alternative hypothesis, which stands true. Conversely, the null hypothesis is retained if the test statistic does not fall within the rejection region.
This method is widely used in finance to evaluate the importance of correlations between variables, such as stock returns and market indices. This helps investors make well-informed investment decisions and risk management strategies.
Types
A test statistic is a value computed from sample data to draw inferences or make decisions about a population parameter. The selection of a specific statistical measure depends on the hypothesis being tested and the characteristics of the data. Here are some commonly employed measures:
#1 - Z-Score
Z-test is utilized when there is a known population standard deviation and large sample size. It quantifies the standard deviation by which a data point or sample mean deviates from the population mean. One can use a test statistic z calculator available online for calculating Z-scores.
#2 - T-Score
A t-test is used when the population standard deviation is unknown or when the sample size is small. Similar to the Z-score, it incorporates the sample size and estimates the population standard deviation.
#3 - Chi-Square Statistic
The chi-square test statistic examines the independence and goodness of fit in categorical data. It assesses the difference between observed and expected frequencies in a contingency table or the fit of an observed frequency distribution to a scheduled distribution.
#4 - F-Statistic
This statistical measure is used in the analysis of variance (ANOVA) to test the difference between the means of two or more data sets. It compares the variability between groups to the variability within the groups.
#5 - Pearson Correlation Coefficient
It quantifies the direction and strength of the linear relationship between two variables. It is frequently used in hypothesis tests to understand if there is a significant correlation in the population.
#6 - Regression Coefficient
In regression analysis, the regression coefficient (the beta coefficient) measures the relationship between the independent and the dependent variables. Thus, the hypothesis tests are conducted to determine if the coefficient significantly differs from zero.
Formula
A test statistic is a value calculated from sample data in a hypothesis test. The specific formula depends on the test type and underlying statistical distribution. Different hypothesis tests have various statistical measures and corresponding computations. Here are two commonly used measures and their formulae:
#1 - Z-Test
In the z-test, the statistical measure is a standard normal random variable that gauges the statistical gap between the sample's mean and the population mean. The formula is:
z = (x - μ) / (σ / √n)
Where:
- x represents the sample mean
- μ represents the population mean (hypothesized value)
- σ, represents the population standard deviation (known or estimated)
- n represents the sample size
#2 - T-Test
In the t-test, the statistical measure is the sample mean less the hypothesized population mean, the result of which is then divided by the standard error obtained for the sample mean. The formula is:
t = (x - μ) / (s / √n)
Where:
- x represents the sample mean
- μ represents the population mean (hypothesized value)
- s represents the sample standard deviation
- n represents the sample size
Examples
Let us consider the following instances to understand how test statistics are relevant in serving different purposes:
Example #1
Suppose Jake, an analyst, wants to estimate the average expense of the residents of San Francisco. He takes a sample size of 400 people from different city areas. The sample mean acquired is $105, while the population mean, according to the census, is $102. To determine the test statistic using the z-score, given that the population's standard deviation is $15, Jake conducts his analysis.
- z = (x - μ) / (σ / √n)
- z = (105-102) / (15/ √400) = 4
Thus, according to the z table, the value, which is greater than the standard value of 1.96 in this case, signifies that the null hypothesis stands rejected.
Example #2
Imagine Will, a financial analyst at PQR Investments, evaluates the performance of two investment portfolios managed by his company. Hannah manages Portfolio A, which is a conservative portfolio and concentrates on blue-chip stocks. Conversely, Mark manages Portfolio B, a more aggressive portfolio with a mix of growth and value stocks.
According to PQR Investments, Portfolio A generates higher yearly returns than Portfolio B. However, Will performs a statistical analysis and discovers that Portfolio A has an annual return of 8% while Portfolio B boasts a 10% annual return.
Will calculate the test statistic using a sample size of 50 investors in each portfolio and a standard deviation of 2% for both portfolios. After performing the calculations, Will obtains t = −5.656.
Will realizes that there is a statistically significant difference in the average yearly returns between the two portfolios. Contrary to PQR Investments' claims, Portfolio B outperforms Portfolio A. Will suggests additional research and possible modifications to Hannah and Mark's investing methods to maximize returns.
