Table Of Contents
What is Sum of Squares?
The sum of squares (SS) in statistics refers to the technique of measuring the deviation of a data set from its mean. In other words, its output indicates the intensity of variation of observations or measurements from its mean value.
In statistics, the SS method is applied to evaluate model fit. If the SS value equals zero, the model is a perfect fit. The smaller the SS value, the smaller the variation and the better the model fits the data. The greater the SS value, the greater the variation, and the poorer the model fits your data.
Key Takeaways
- The sum of squares (SS) is the statistical method used to measure the variation of a data set from its mean.
- Its calculation involves calculating the mean of observations, finding the difference between each observation and the mean, calculating the square of each difference, and the total of all squares obtained.
- A higher SS value denotes a higher variability of data from its mean; likewise, a low SS value indicates that the data is not far from the mean. If the value of SS is zero, the model is perfectly fit.
- It is widely used in various fields like business, finance, and investing.
Sum of Squares Explained
The sum of squares (SS) method discloses the overall variance of the observations or values of dependent variable in the sample from the sample mean. The concept of variance is important in statistical techniques, analysis, and modeling, especially regression analysis. The technique is widely used by statisticians, scientists, business analysts, finance professionals, traders, etc. For example, traders can use this method to evaluate the stock price movement around the mean price.
SS involves calculating mean value, variations, and a total of squares of variations. Whenever a data set is taken for study, its average or mean is a commonly calculated item which further helps in defining other values related to the data. For example, the mean is important for calculating SS, and averaging the SS gives variance, and standard deviation can be derived by computing the square root of variance. All these values are useful in understanding how dynamic the data set is or how far or close it is to the mean.
In many statistical models, it is imperative to know the variability to estimate the fluctuation between the recorded frequencies or values and predicted values. In addition, the variability gives an analyst an idea of how much the data can move in either direction from its average mean. Hence, further decisions are made based on that.
There are different types of SS. Some of the significant types are the following:
- Total Sum of Squares: TSS explains the variation between observations or dependent variable’s values and its mean.
- Regression Sum of Squares: It explains how well a regression model represents the data. A higher value indicates that the model does not fit the data well and vice versa.
- Residual Sum of Squares: It measures the level of variation of modeling errors that the model cannot explain. Generally, a lower value indicates that the regression model can better fit and explain the data and vice versa.
Formula
The sum of squares formula in statistics is as follows:
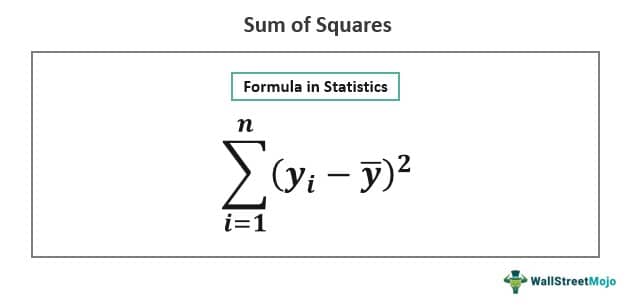
In the above formula,
- n = Number of observations
- yi= ith value in the sample
- ȳ = Mean value of the sample
It involves the calculation of the mean of the observations in the sample, then finding the difference between each observation from the mean and squaring the difference. Then the total of the squares is calculated.
Other basic formulas includes:
- In algebra, SS of two values is: a2 + b2 = (a + b)2 − 2ab
- SS of n natural numbers: 12 + 22 + 32 ……. n2 = / 6
Calculation Example
Stock traders and financial analysts often use the SS technique to study the variability of stock prices. To understand with a sum of squares example, suppose there is a stock with the closing price of the last nine days as follows: $40.50, $41.40, $42.30, $43.20, $41.40, $45.45, $43.20, $40.41, $45.54.
Step 1: Calculate mean value
The mean of the stock prices = Sum of stock prices/total number of stock prices
= ($40.50 + $41.40 + $42.30 + $43.20 + $41.40 + $45.45 + $43.20 + $40.41+ $45.54)/9
= 42.6
Step 2: Calculate deviation from mean
40.50 - 42.6 = -2.1
41.40 - 42.6 = -1.2
42.30 - 42.6 = -0.3
43.20 - 42.6 = 0.6
41.40 - 42.6 = -1.2
45.45 - 42.6 = 2.85
43.20 - 42.6 = 0.6
40.41 - 42.6 = -2.19
45.54 - 42.6 = 2.94
Step 3: Square all the differences obtained in step 2
(-2.1)2 = 4.41
(-1.2)2 = 1.44
(-0.3)2 = 0.09
(0.6)2 = 0.36
(-1.2)2 = 1.44
(2.85)2 = 8.12
(0.6)2 = 0.36
(-2.19)2 = 4.79
(2.94)2 = 8.64
Step 4: Add the squares
4.41 + 1.44 + 0.09 + 0.36 + 1.44 + 8.12 + 0.36 + 4.79 + 8.64 = 29.66
Sum of Squares = 29.66
