Table Of Contents
Structural Equation Modeling (SEM) Definition
Structural Equation Modeling (SEM) is a statistical tool used to assess and validate complex relationships between observed and latent variables. It helps users evaluate the interdependencies among multiple variables simultaneously by considering both measurement and structural models. It is commonly employed for hypothesis testing, model comparison, and theory validation.
The method combines factor analysis and multiple regression to understand the fundamental structure of relationships in a theoretical framework. It is valuable in fields like social sciences, psychology, and economics, where researchers analyze intricate relationships between variables. The model aids in accounting for measurement errors and complex interactions among different factors.
Key Takeaways
- Structural Equation Modeling is a method in statistics for assessing and verifying complex connections between latent and observed variables.
- It assists individuals in simultaneously assessing the interdependencies between several variables by taking into account both structural and measurement models.
- It can be beneficial in disciplines where researchers examine complex interactions between variables, including behavioral sciences, psychological research, and economics.
- This modeling is based on assumptions. Violations of the assumptions may impact the results' accuracy and dependability.
Structural Equation Modeling Explained
Structural Equation Modeling (SEM) is a statistical method for exploring and testing complex relationships among variables within a framework. It assists in the analysis of observed and unobserved or latent variables. The model offers a structure to represent and analyze complex relationships between multiple variables simultaneously.
SEM merges two primary elements: measurement and structural models. The measurement model determines the relationships between latent variables and their observed indicators. It addresses the measurement error and reliability. Additionally, the structural model assesses the relationships between latent variables. It enables researchers to test theories related to the relationships and causal pathways among these constructs. This technique is instrumental in fields like economics, social studies, and psychology, where researchers aim to recognize the complex systems of interrelated variables.
Types
Some structural equation modeling types include the following:
- Partial Least Squares Modeling: It is a component-based approach that focuses on predicting latent variables by identifying relationships between observed indicators and the underlying constructs. It is suitable for predictive modeling and is applicable in domains like marketing and business research, where the primary concern is prediction and practical application.
- Multilevel Modeling: This type incorporates hierarchical data structures. It enables data analysis that has a nested or clustered nature, like individuals within groups. It accounts for dependencies and variations at multiple levels of analysis.
- Latent Class Modeling: This SEM type combines SEM with latent class analysis. It enables the identification of unobserved subgroups within a population. It is useful when there are distinct but unobserved subgroups that may have different relationships among variables.
Examples
Let us study the following examples to understand this modeling:
Example #1
Suppose Jake is an analyst assessing the relationship between three factors: investment, profitability, and company size. The SEM is based on the assumption that the company size directly influences investment and profitability. Jake's model states that larger companies tend to invest more in diverse portfolios, which positively impacts their profitability.
Moreover, he proposed that profitability directly influences the level of investment, and a more profitable company is likely to invest more. The model illustrates these relationships with arrows, showing the directional paths between the variables. He analyzed how the factors were interrelated by collecting data on various companies' sizes, investment amounts, and profitability measures.
Example #2
Students who study online face specific challenges like reduced social support and increased distractions. A study was conducted employing SEM to analyze the relationship between the study's variables. This study used the Tencent Meeting app in China to examine the structural relationships between academic resilience, personality, academic well-being, and educational success.
The mediating role of student engagement in the connection between the variables was also investigated in this study. 384 undergraduate, graduate, and postgraduate students from China's Henan Polytechnic University took part in the study.
Diagram
The structural equation modeling diagram is as follows:
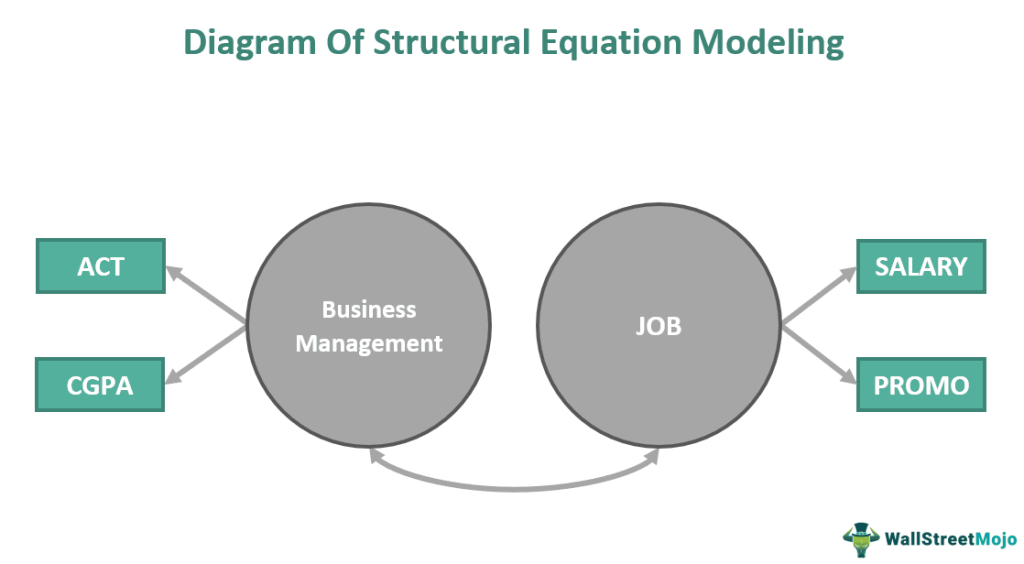
The structural equation model above illustrates the relationship between a course in Business Management and Job components. It depicts how factors like the scores of an individual on ACT (American College Testing) and CGPA (Cumulative Grade Point Average) may impact the elements of their profession, like their salary and promotion.
Individuals who secured high scores on their ACT and CGPA were preferred candidates in the job market. This is because employers assumed that such candidates had more knowledge and expertise in their domain.The model suggested that individuals with higher scores are more likely to get a higher salary and better promotion opportunities.
Benefits
The benefits of structural equation modeling are as follows:
- It allows researchers to explore complex relationships among multiple variables simultaneously. It accommodates both observed and latent variables and provides a more comprehensive understanding of intricate relationships.
- Researchers can test and refine theoretical models and assess the fit of their proposed models to empirical data. This enables the validation and improvement of theories based on real-world data, resulting in robust and evidence-based conclusions.
- It integrates various statistical techniques like regression analysis, factor analysis, and path analysis. Thus, it is a versatile tool suitable for different data types and research designs.
- Users can compare multiple models to determine the most suitable representation of the relationships in their data. Additionally, SEM provides fit indices that help in assessing how well the model matches the observed data.
- SEM techniques are capable of handling missing data. This allows for robust analysis even when there are incomplete observations in the data set.
Limitations
The limitations of structural equation modeling analysis are:
- It requires relatively larger sample sizes. Inadequate sample sizes lead to model estimation issues, reduced statistical power, and biased results.
- Building and interpreting these models can be complex and requires a strong understanding of statistical concepts and the subject matter. Misinterpretation of SEM may lead to erroneous conclusions.
- This modeling has underlying assumptions. Violating the assumptions may affect the accuracy and reliability of the results.
- The accuracy of SEM results depends on the data quality. Measurement mistakes or biases in observed variables can influence the estimation of relationships among variables and impact the model's overall correctness.
- Complex models with too many parameters in relation to the available data can lead to overfitting. In this scenario, the model fits the existing data well but fails to predict new data accurately.
Structural Equation Modeling vs Regression vs Path Analysis
The differences between the two are as follows:
Structural Equation Modeling
- SEM is a comprehensive statistical technique that extends both regression and path analysis. It allows for the simultaneous evaluation of complex relationships between observed and latent variables.
- It includes both measurement and structural models and accommodates multiple relationships. It offers insights into direct, indirect, and mediating effects.
- This modeling can handle latent variables, measurement errors, and the assessment of complex models with numerous variables.
Regression Analysis
- Regression analysis focuses on predicting the relationship between a dependent variable and one or more independent variables. It estimates the strength and direction of the relationship between variables.
- It usually works with observed variables and does not account for latent variables.
- The method is valuable for understanding direct relationships.
Path Analysis
- Path analysis focuses on analyzing the direct relationships between variables. It often uses diagrams to illustrate the pathways.
- It has limitations as it only considers direct relationships among observed variables and ignores latent variables or more complex indirect relationships.
- The analysis helps in understanding direct causal paths but cannot assess overall model fit or accommodate measurement errors.
