Table Of Contents
What is a Stock Market Bubble?
Stock Market Bubble is a phenomenon where the prices of the stock of the companies do not reflect the fundamental position of the company. Because of this, there is a divide between the real economy and the financial economy caused either due to the irrational exuberance of the market participants or due to herd mentality, or any other similar reasons.

The prices of securities traded on the stock market get affected by various reasons, such as the introduction of a liberal governmental regulation or expansionary measures undertaken by the central bank of the country, such as the reduction in the policy rate by the federal reserve. In this situation, the stock prices are inflated and can't be supported by the company's actual performance and profits.
Table of contents
Stock Market Bubble Explained
A stock market bubble is an economic phenomenon that takes place in the stock market when the participants of the market inflate the prices to irrational levels which ultimately results in a crash or a crash-like situation in the market. In the scenario of a stock market bubble burst, the prices drastically decrease and panic situation is prevalent.
Government regulations and measures by the central bank of the country are taken to revive the market. Such measures encourage people to take out money from fixed-income instruments and invest the same in the riskier equity market to expect higher returns. Therefore, it is expected that the companies would perform better due to such policy changes, and therefore their shares will rise.
Such expectations may not always be aligned with the actual economic activity that is taking place in the real economy because, at times, these measures are not able to boost the economy as much as possible. However, such market information is not always complete, and therefore the financial markets are not completely efficient. This implies that the prices do not convey all the publicly or privately available information.
Many traders use Saxo Bank International to research and invest in stocks across different markets. Its features like SAXO Stocks offer access to a wide range of global equities for investors.
Process
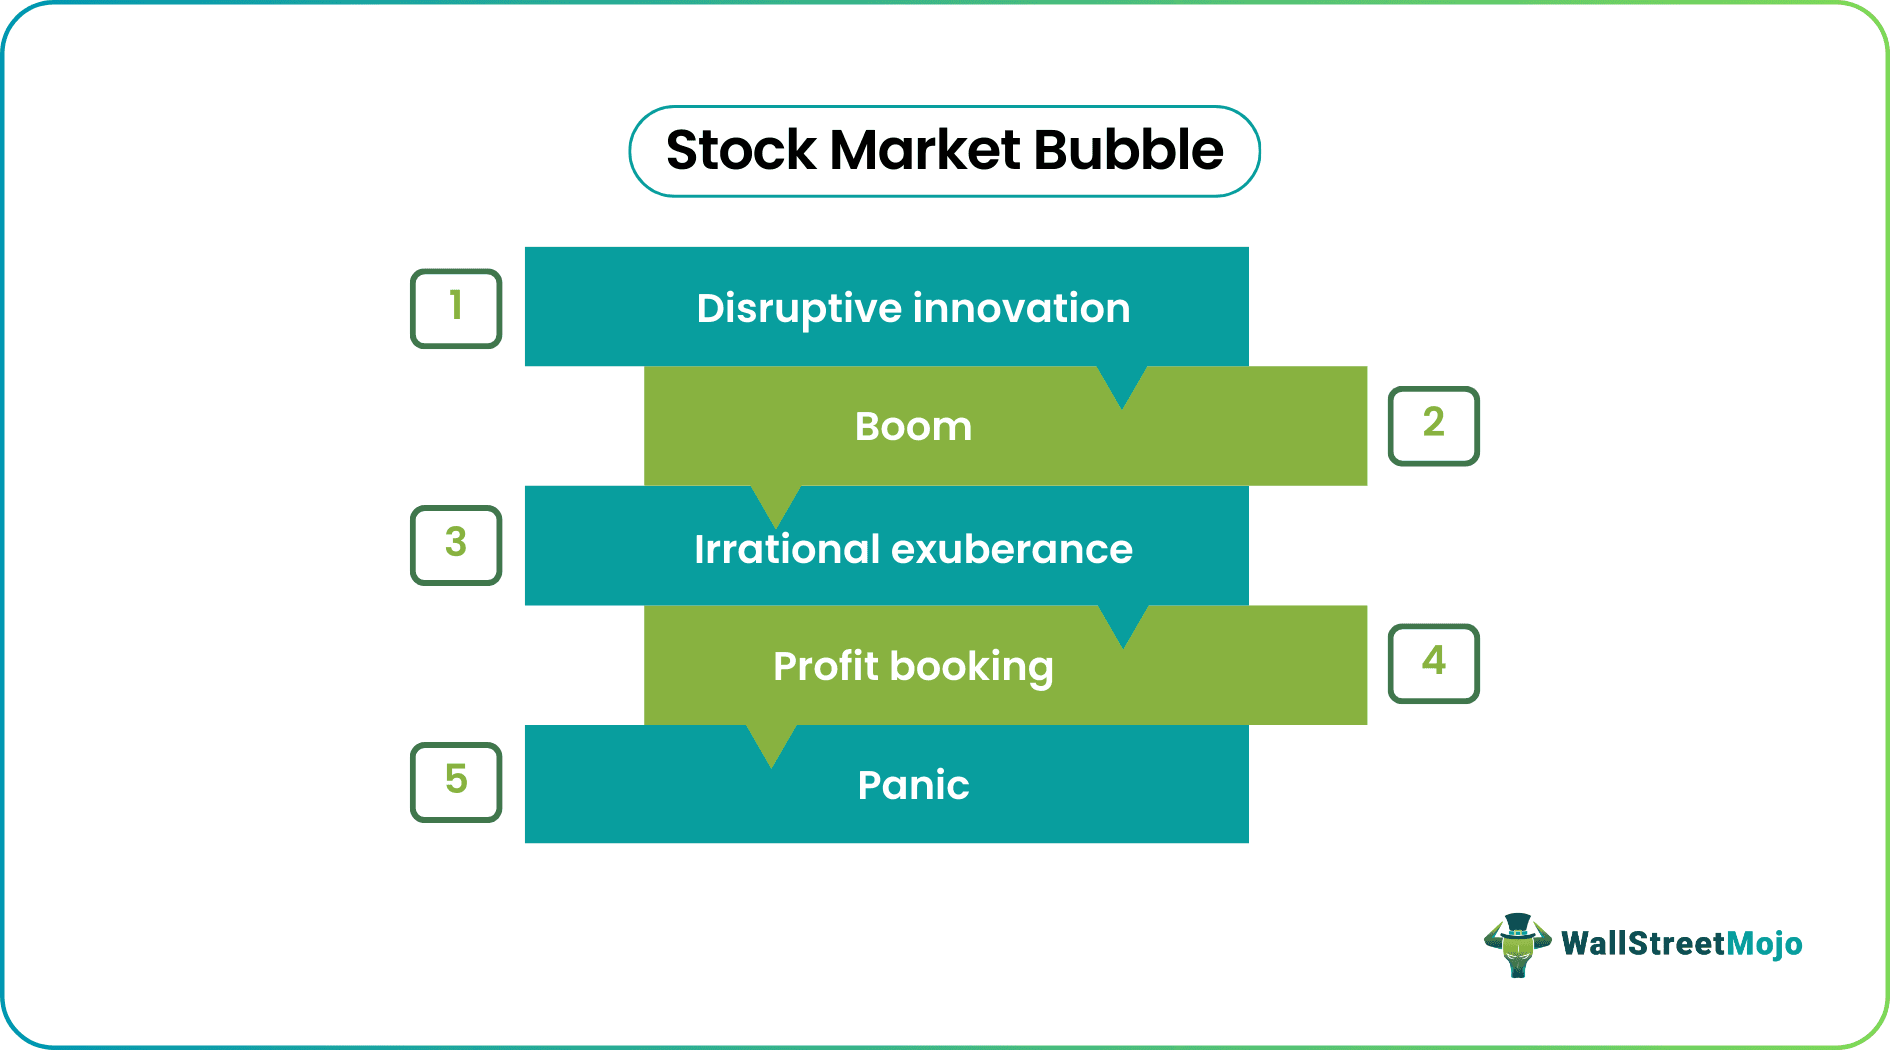
Following is the bubble formation process; let's understand it through the example of the dotcom bubble of 1999:
#1 - Disruptive Innovation
Internet technology was a completely new technology that would revamp how the world functioned. Therefore, it looked highly promising, and therefore a lot of companies entered this domain during the period 1990 to 1997 to profit from this prospective new industry.
#2 - Boom
Several companies saw an initial level of success, and the investors started flowing in the money in hopes of higher returns. This attracted even more companies into this sector who might not have had the capabilities to give a strong performance but were dragged by the booming sector. Further, the tax reforms and cheaper credit availability encouraged these companies to enter this new market. This was the era when Netscape and Yahoo! released their IPOs.
#3 - Irrational Exuberance
At this stage, the investors lose perspective of performance and keep pouring in money without realizing that the companies are not doing their bit. Therefore the promising returns might not occur at all. This led to a greater divide between performance and return expectations and inflated the stock prices. This was when NASDAQ quadrupled, and the P/E ratios soared beyond any limit.
#4 - Profit Booking
- When the Fed started realizing they were heading towards a bubble, it started increasing interest rates, and the funding became volatile.
- Further, many duplicate companies had emerged, and there were talks of mergers among them. Failed mergers led to NASDAQ declining gradually.
- Japan, the technology giant, went into another recession.
- Investors started realizing that their expectations might not be aligned with the performance; they started selling and booking profits or accepting lower levels of losses so that they may not have to sell their investment at thrift's price in times to come; this ensured a correction in the market where the stock prices started falling.
#5 - Panic
- Globally, the markets started witnessing such incidents, and by this stage, several investors saw their wealth eroding and joined the selling spree.
- Investors started selling at whichever price possible to exit the sector and save their necks. This was when the bubble burst and led to the market crash.
- Websites such as Pets.com went out of business, and several accounting scandals started emerging, such as that of Enron and Satyam.
- By this time, the technology stocks lost approximately 3/4th of their value.
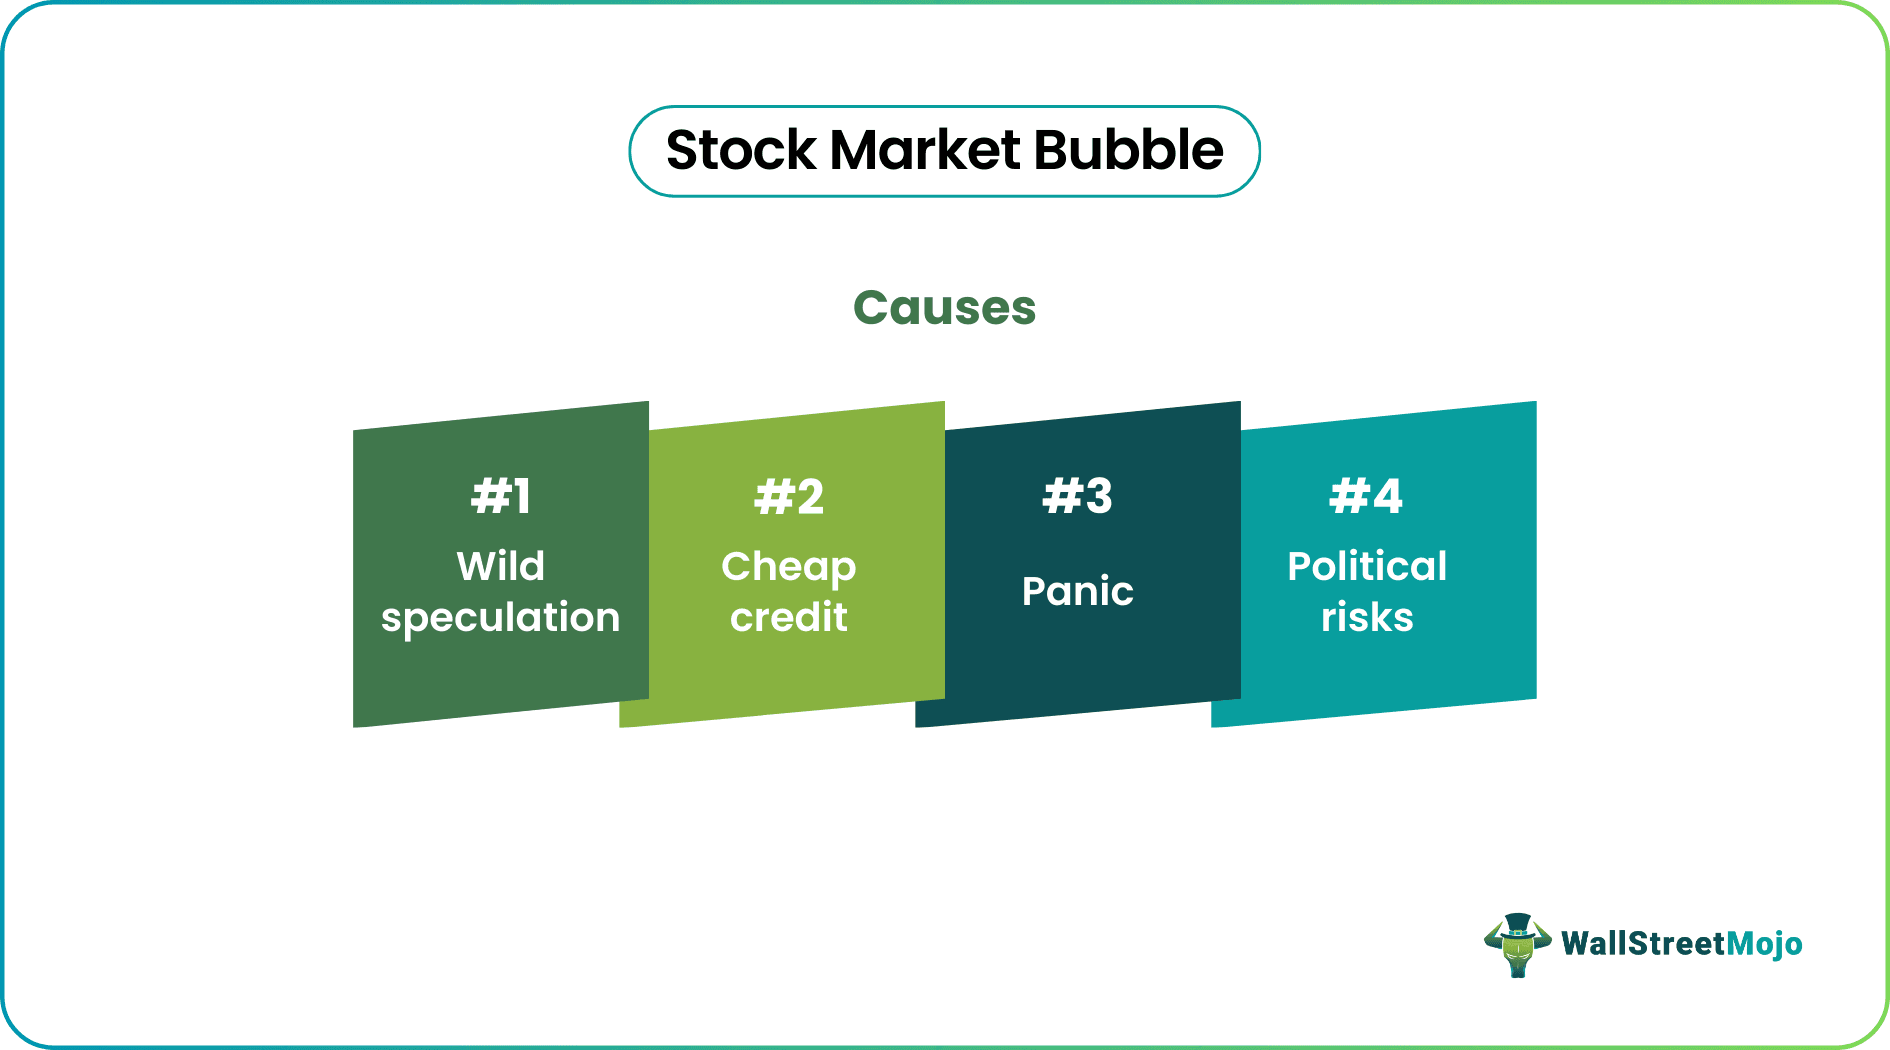
Causes
From the plethora of reasons leading to the stock market bubble burst and market flow disruption, we have discussed the most prevalent causes through the discussion below.

#1 - Wild Speculation
This is one of the most important reasons that lead to stock market bubbles because this is why the gorge between the financial and real economy widens. When the market participants are not ready to accept the challenges that the real economy is facing and are still buying the stocks of companies that are underperforming in an expectation that they will gain when these companies do well, it leads to inflation in stock prices creating a bubble.
#2 - Cheap Credit
When the loans are available at very low-interest rates, the central banks are still on a rate-cutting spree. It is bound to cause a boom in the non-performing assets in the times to come because the cheap credit is borrowed by even those who don't intend to pay it back. Therefore, such borrowers are forced to sell assets, which leads to a reduction in production capacity, thereby signaling a weaker economy, so stock prices start falling.
#3 - Panic
When the investors start realizing that the financial economy is about to crash, panic selling begins, and people start booking profits or limiting losses, leading to falling in-stock pricing. This initiates a crash in the economy, and a time comes when some stocks can't find buyers at even the lowest of the low prices.
#4 - Political Risks
When the geopolitical risks increase and people start feeling unsafe in the country, the stock market initiates dipping, and if necessary, measures are not taken timely, the crash becomes inevitable.
Indicators
Yield curve analysis is a popular tool for analyzing the economic situation. For example, if the short-term debt instruments have a higher yield than the long-term ones, we can say that the economy might be entering into a recession. On the other hand, if such is the case and the stock market is still showing constant increases, then there is a strong chance that the stock market is experiencing a bubble.
The above-explained yield curve is called an inverted yield curve, and it implies that the investors are ready to forgo higher interest rates in the future because they want to keep their investments safe. They have no faith that the economy will do well in the future. Therefore the interest rates received on fixed deposits are higher in present times, and they will fall because the demand will be higher for such instruments, so the cost of these will be higher. As interest rates and prices are inversely related, the interest rates in the future will be lower.
Examples
One of the most popular bubbles in the history of the twentieth century is the crash of Wall Street in 1929, following which the great depression occurred. This was when the NYSE stocks crashed, leading to erosion of wealth for scores of investors; this crash followed the crash of the London Stock Exchange and led to the starting of the Great Depression.
WWI had just ended, and there was over-optimism in the population, which was migrating to urban areas to find high-paying work in the industrial expansion. There was very high speculation, leading to a divide between the actual product and the speculations about the same, ignoring the fact that steel production, construction activity, and auto sales were all slowing down while unemployment was rising.
Bankers gave easy credit that fundamentals couldn't back. The Dow Jones industrial average was still climbing greater heights. These were signals that the bubble had inflated way too much and would burst anytime, which led to investors entering a selling spree, which led to the stocks losing value constantly, and finally to a crash in October 1929.
Consequences
The stock market bubble chart usually brings panic and pessimism in the market and tens of thousands of people lose their money. However, in the bigger scheme of things, major economic factors get affected. Let us discuss a few of the major consequences through the discussion below.
- Crash of Market: As explained above, there comes a time when the bubble inflates beyond the threshold, and even a tiny pin poke can burst it, leading to a crash in the market when wealth is eroded completely, stocks lose all their value, and the economy goes into recessions.
- Recession: As the market crashes, it becomes explicit that the economy has not been doing well for a while, and therefore, recession sets in, people get laid off, and austerity measures set in. It becomes impending for the fiscal and monetary policymakers to boost the economy and set the industry back on track.
- Widespread Discontent: When the economy doesn't do well, people's savings get eaten up, and the future starts looking bleak, people lose hope and motivation leading to instability in the economy.
Disclosure: This article contains affiliate links. If you sign up through these links, we may earn a small commission at no extra cost to you.
Recommended Articles
This article has guided to guide to what is Stock Market Bubble. Here we discuss its causes, indicators, and examples to understand how it works and affects the market. You can learn more about it from the following articles –

