Table Of Contents
What Is A Stock Index?
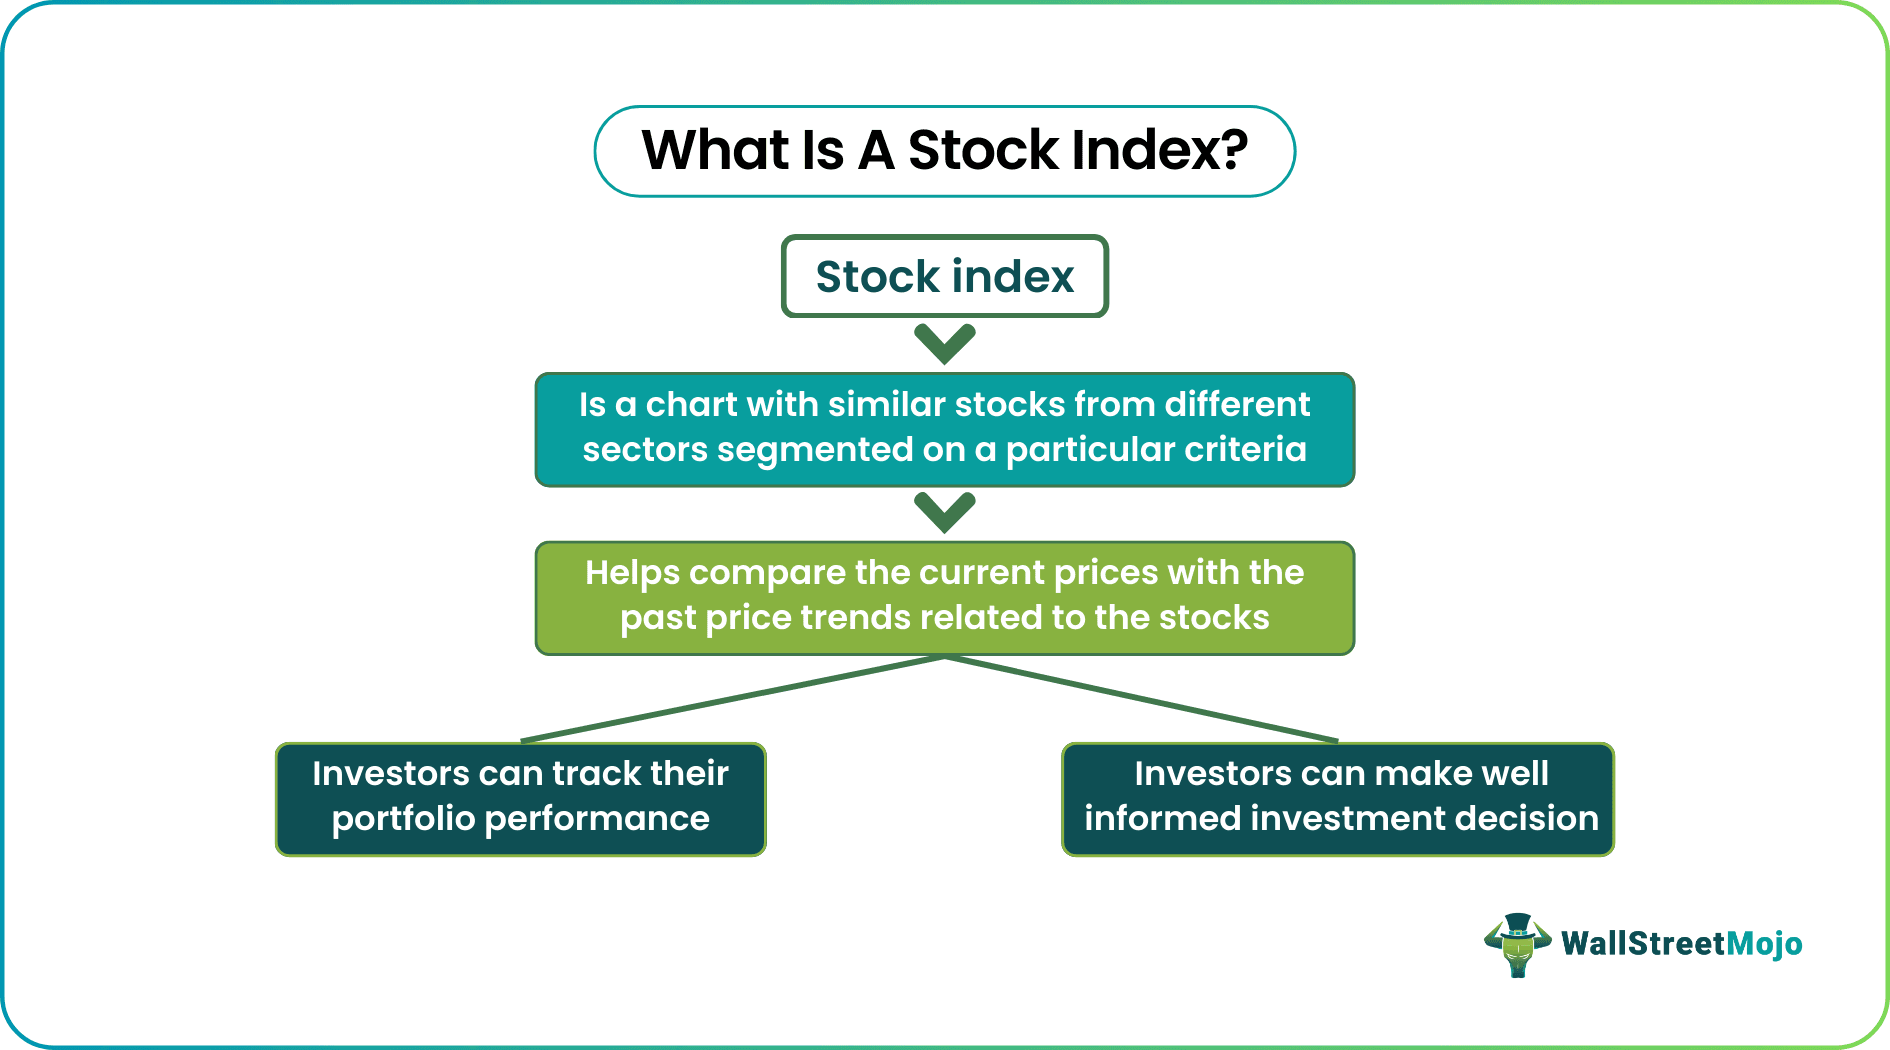
A stock index refers to a chart prepared to reflect the changes in the market, considering the performance of the stocks belonging to companies from multiple sectors. It exhibits the difference between current and past stock prices, helping investors understand the latest trends and market performance.

Also known as the stock market index, these statistical representations of data are done with respect to the markets concerning a particular country, industry, company size, dividend portion, growth rate, valuation, etc. In short, these factors become the determinants depending on which players of the index are chosen.
Table of contents
- What Is A Stock Index?
- The stock index, also known as the stock index, is a tool used to determine the performance of shares/securities in the market and to calculate the return on the stock of their investment. In addition, investors use it to know the version of investments and access the total value they possess.
- Indexes are often used as a benchmark against which performances of mutual funds and Exchange-Traded Funds (ETFs) are compared.
- These indexes help investors track the performance of their portfolios and also enable them to make well-informed investment decisions.
- The major five stock indexes include Standard & Poor's 500 (S&P 500), NASDAQ Composite, Dow Jones Industrial Average, Financial Times Stock Exchange (FTSE) 100 Index, and Russel Indexes.
Stock Index Explained
A stock index is a blessing for those unable to make proper comparisons between stocks before deciding where to invest. Investing is an important decision which serves effective only when the investors are well-informed. With the help of these indexes, people come across the stocks of different companies belonging to different sectors and countries with different market capitalization and sizes.
Depending on the parameters based on which the world stock index segregates the data, investors study and analyze the collected information. This lets them assess the portfolio's performance and keep track of it before and after investing. This segregation keeps similar stocks in one category based on the country, industry, business size, market cap, etc. They are the stock listed on the exchange and available publicly for investors. Some exchanges include New York Stock Exchange (NYSE), NASDAQ, National Stock Exchange (NSE), London Stock Exchange, etc.
Through the stock index funds, investors get a platform to monitor their portfolios and check the performance of the stocks they have invested in. In addition, they also utilize the chart to take a comparative look at the current and past prices of the stocks and accordingly make well-informed and wise investment decisions.
Investors choose to invest in stock index funds, also called index funds, that reflect the data represented in the concerned indexes. Similarly, they can invest in stock index futures or equity index futures, which are futures contracts reflecting the stock indexes.
Many traders use Saxo Bank International to research and invest in stocks across different markets. Its features like SAXO Stocks offer access to a wide range of global equities for investors.
Types
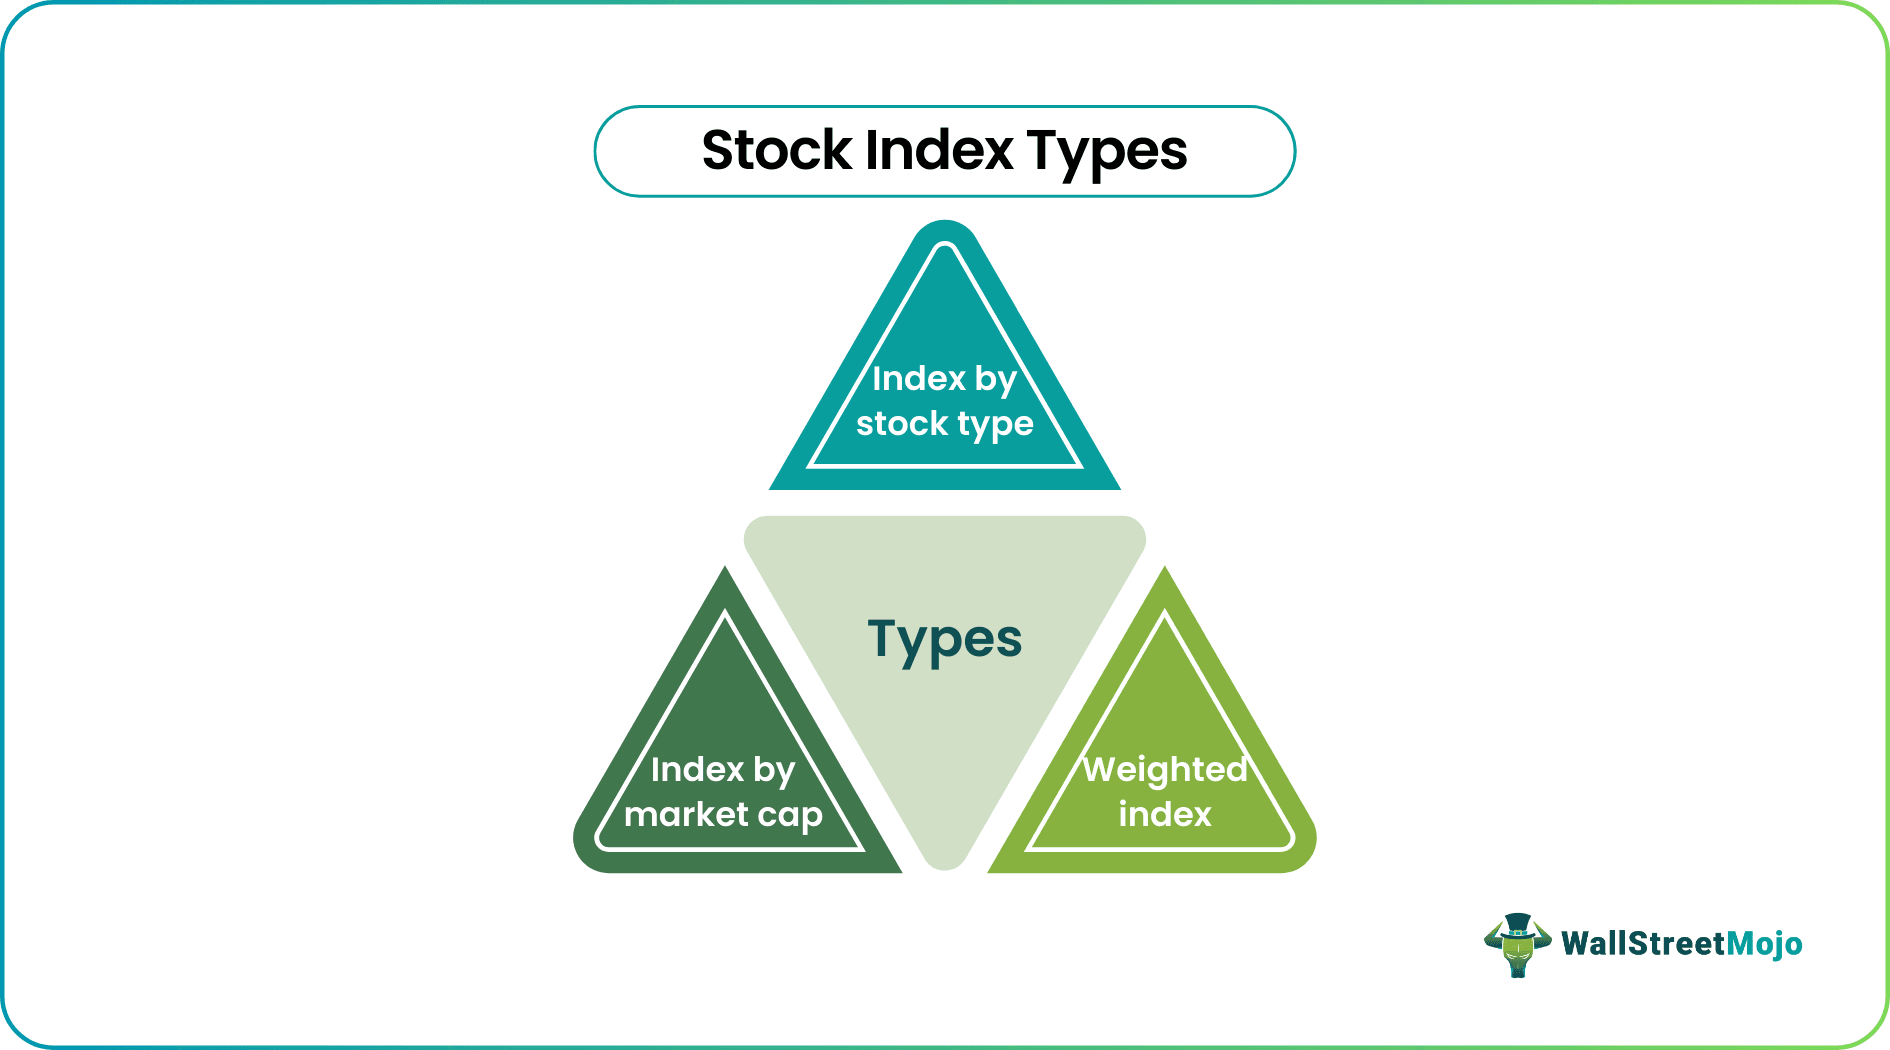
The global stock index are classified into three categories based on the determinants used to segment them. These include index by stock type, market cap, and weighted index.

#1 - Index By Stock Type
A stock index segregates the stocks based on their type. The analysts prepare these indexes after evaluating the assets properly. As a result, they either include the stocks trading at a price lower than their book value and earnings or those trading at a relatively higher price with higher price-to-earnings ratios. While the former signifies stocks from slow-growing firms, the latter belongs to companies with above-average sales growth.
The S&P 500 Value Index includes stocks of mature but slow-growing companies. On the contrary, the S&P 500 Growth Index displays stocks with above-average sales records. Examples of the former type are JPMorgan Chase, AT&T, and Berkshire Hathaway, while the latter includes stocks from Apple, Amazon, Facebook, etc.
#2 - Index By Market Cap
As the name suggests, these indexes include stocks of companies with higher market caps. For example, the S&P 500 is an index that includes firms with large-cap portions. It is part of the S&P 1500, the rest being S&P MidCap 400 and S&P SmallCap 600, which include companies with mid-cap and small capitalization, respectively.
#3 - Weighted Index
These indexes reflect the stock prices and movements depending on the weight assigned to them. The ones weighted high to influence the movements exhibited in the index and vice-versa. There are three types of weighted indexes:
- Price-weighted index, which lists companies with higher stock prices.
- Market-capitalization-weighted index, which includes companies with higher market cap.
- Equal-weight index, which weighs each stock equally irrespective of the factors, like price, market cap, valuation, etc.
Examples
Let us consider the following examples of world stock index to explore the two major stock indexes operating in the market.
#1 – Standard & Poor’s 500 (S&P 500)
The S&P 500 is a large, diverse, and market-capitalization-weighted index of the 500 most widely traded stocks, especially in the USA. If the total market value of 500 companies in the S&P 500 increases by 6%, the value of the index also increases by 6%.
It lists firms from various sectors, including the financial sector, healthcare, consumer staples, information technology, industrials, energy, media, etc.
#2 – NASDAQ
It's a US index predominantly known for technology-based companies such as Google, Apple, and other firms in the growth stages. The NASDAQ measures the performance of around 3,000 companies, including foreign ones. In addition, it also hosts stocks from other sectors, like insurance, energy, transportation, industrial, etc.
The value of NASDAQ depends on the company's outstanding stock, i.e., the market capitalization average of multiple firms part of the index. Therefore, the performance of the NASDAQ is directly proportional to the technology sector's performance.
In addition, there are three different market tiers, namely, capital market (Small-cap), global market (mid-cap), and global stock market (Large Cap).
#3 – Dow-Jones Industrial Average (DJIA)
It is one of the oldest and most well-known indexes globally, comprising 30 major companies belonging to the industry leaders, which significantly contribute to the industry and stock market. The DJIA is a price-weighted stock index, which indicates that no stock split or adjustment is considered in the average price computation.
Consisting of some well-established companies in the US, large swings in the index generally correspond to the entire market movement. However, these movements are not necessarily on the same scale.
Volatility
Volatility refers to the fluctuations in the process of stocks that are listed in the index. It is a benchmark to measure the expectation of the market participants. Some statistical measures like standard deviation or variance are used for the measurement of major stock index. It estimates the risk and uncertainty level of the market.
There are several factors contributing to it, as follows:
- Economic factors like GDP, interest rates, inflation and unemployment impact volatility of stock index funds leading to uncertainty.
- The sentiments and psychology of the investors affect volatility level. Any kind of geopolitical events, positive or negative news related to corporates or political environment and create fear or optimism as the case may be.
- Any global or natural disasters, trade disputes among countries, political instability, influence the volatility of the stock market. They introduce lack of confidence and pessimism.
- The trading volume plays a very important role. If trading volume is high, it means the market participants are actively trying to gain from the market conditions, which is a positive sign. However, low trading volume signifies that investors are staying away from the market. This will amplify the volatility level.
Traders, investors, and analysts continuously monitor the major stock index to understand and interpret the risk and return level. High volatility allows traders to make quick profits within a short period, which requires both knowledge and expertise because of the very high-risk level. Low volatility indicates stable market conditions but less opportunity to trade.
How To Read Stock Index?
Reading and interpreting the global stock index requires analysis of its components, price fluctuations and some other important data. Let us identify the steps for doing the same.
- Index identification – The investor has to identify the index to be analysed. As list of such indices are give above.
- Components and weighing – It is important to understand the composition of the index and the companies whose stocks are listed in it. The weighing methods of the components vary between indices. Methods can be market capitalization, equal weights, etc.
- Monitor price movements – Over time the price movements are monitored. There are various types of charts used for reference that provide historical data as well as real time data for comparison and analysis. The price fluctuations, trensds and patterns provide great insight into the market sentiments and also help in forecasting the future.
- Sector analysis – This is an important step where fundamental analysis is done to get a better picture of the sector’s performance. The revenue growth, valuation, earnings, change in holding by various market participants and overall performance is evaluated.
- News – The daily news updates play an important role. Any positive or negative news directly impact the index and the stock prices move up or down accordingly.
- Comparison with other assets – This contributes to good insights towards market performance because we can understand which is better investment opportunity. We can accordingly devise risk management strategies.
Thus, stock index interpretation is a combination of technical and fundamental analysis. Such knowledge is essential before anyone tries to invest in the market so they can earn good returns and manage their losses efficiently.
Disclosure: This article contains affiliate links. If you sign up through these links, we may earn a small commission at no extra cost to you.
Frequently Asked Questions (FAQs)
These funds are types of mutual funds and exchange-traded funds (ETFs) that reflect a particular market index movements and performances. These financial instruments neither attempt to beat the market nor do they try to reap more returns. Instead, they just reflect the index they belong to and help investors assess the market conditions.
The value of the stock index of each company is calculated by multiplying the number of shares listed and the price per share, which results in the company's market cap. Similarly, the market cap value of other companies in the list is also computed. Finally, the market cap for each company is added to evaluate the index value.
These are futures contracts that reflect a particular index's performance. They are an agreement involving buying or selling the underlying assets on a predetermined date and price. Here, however, the underlying asset exhibits the index performance.
Recommended Articles
This article has been a guide to what is Stock Index. We explain its volatility along with examples, how to read it, and its various types. You may learn more about stock markets from the following suggested articles –

