Table Of Contents
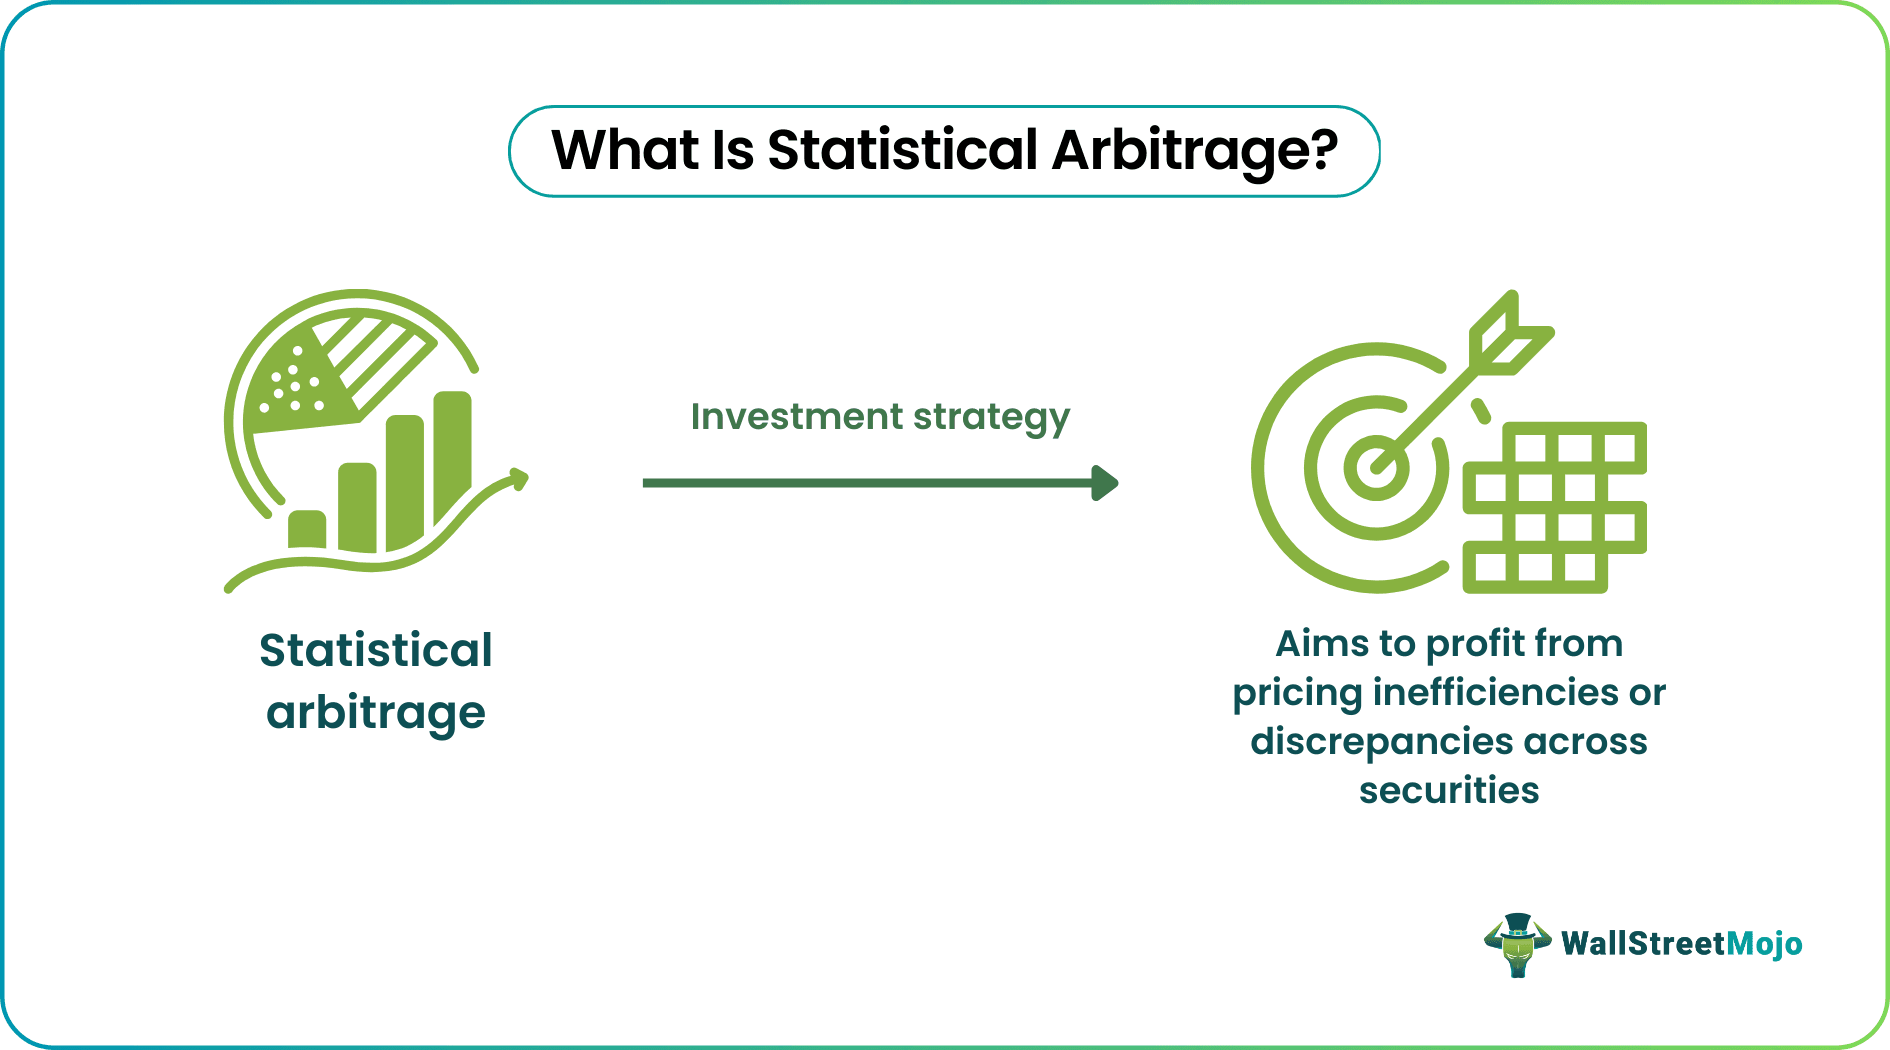
What Is Statistical Arbitrage?
Statistical arbitrage is an algorithmic trading approach that involves investing in a carefully selected group of securities or commodities. The objective is to identify instances where the prices of the chosen securities deviate from what would be expected based on historical patterns or statistical models.
Investors tend to spot arbitrage opportunities through models based on mathematical strategies and exploit price discrepancies of underlying securities. It is a quantitative method based on historical data and past price patterns that indicate the mispricing of securities in the market. It is not limited to a particular sector and can be applied between correlated securities.
Table of contents
- What Is Statistical Arbitrage?
- Statistical arbitrage uses predefined models to spot price discrepancies in assets and generate profit from the simultaneous buying and selling of securities.
- Mean reversion and momentum take the help of historical data and past price patterns to identify stock mispricing in the market.
- The technique is widely referred to as stat arb and primarily uses pair trading by finding a correlation between two securities of a common industry.
- It has risks through mean reversion, price differences and model selection, data inaccuracy, and capturing inefficiencies in the whole trading process.
Statistical Arbitrage Explained
Statistical arbitrage defines trading strategies based on the mispricing of one or multiple assets compared to their expected future value. It is not one but a group of various trading techniques such as index arbitrage, delta neutral or basket trading. All these strategies are employed based on the type, risk appetite, and instrument weightage. However, the most commonly used technique is pair trading.
The pair trading statistical arbitrage in the US equity market is the most common practice executed by investment banks and hedge fund managers. Two or more securities are taken, and their price charts are compared to spot price discrepancies to trade wisely. It relies on two factors - mean reversion and momentum. The former spot stocks with prices deviated from their past average and invested in them, anticipating the price return to its mean. The latter identifies stocks that are moving in one direction and invest in them, hoping that they will continue to do so.
It involves quantitative methods, computation, and statistics for high-frequency trading. Since it lasts for days and involves simultaneous buying and selling of assets, the price gap lasts for a very short time, in milliseconds. It is primarily a high-frequency trading strategy but can be categorized as a medium-frequency trading method only if the course of time is altered.
Many traders use Saxo Bank International to research and invest in stocks across different markets. Its features like SAXO Stocks offer access to a wide range of global equities for investors.
Types
There are primarily four types of statistical arbitrage trading strategies -
- Market neutral arbitrage - This strategy is used in multiple markets by investors looking to exploit the increasing and decreasing prices. It uses historical data for hedging to avoid certain market risks.
- Cross-market arbitrage - This strategy involves buying the security in lower-value markets and selling it in a high-value market. The same asset is exploited for its price discrepancies across the whole market.
- Cross-asset arbitrage - This strategy exploits price discrepancies between a financial asset (such as a stock index) and its underlying components (the securities that collectively comprise the index). It involves taking advantage of the price gap between the index and its securities.
- ETF arbitrage - This strategy is a subform of cross-asset arbitrage that seeks price discrepancies between the ETF and its underlying assets.
Examples
Below are statistical arbitrage examples defining different scenarios -
Example #1
Ronald is a wise investor, who has been trading in the equities market for a long time. Recently he has been pursuing the tech industry. He has two blue-chip stocks in mind: A and B. Ronald believes that stock A is undervalued, and in comparison, stock B is overvalued. Ronald is convinced it is the right time to use statistical arbitrage algorithmic trading insights and techniques in the market. He opens a long position on stock A and takes a short position for stock B. Ronald then compares both the stocks by overlaying their price chart and enters into a trade when the chart out-syncs each other in pricing.
Suppose Ronald bought stock A in February and sold it in April, exploiting the price discrepancies to gain profit. However, Ronald has to be patient because there is no guarantee that the two stock prices will converge, and therefore, he uses stop-loss orders. Primarily, fund managers select stocks that belong to the same industry as it becomes easy to spot correlation in pricing. Still, statistical arbitrage techniques are not limited to only two securities but can be employed in a group of correlated stocks irrespective of their industries.
Example #2
Below is the overlaying price chart of two blue-chip banking stocks of India; the blue line represents HDFC Bank, and the lighter shade depicts ICICI Bank.
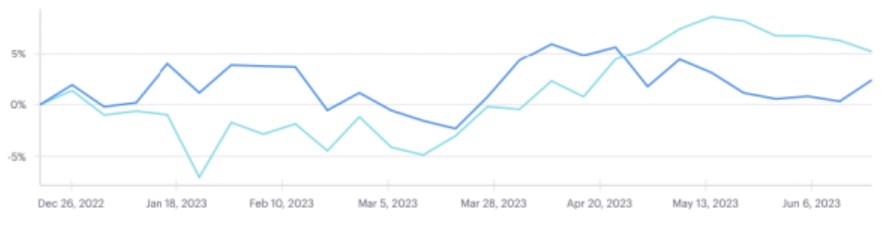
The price chart showcases the price movement of both banks from the last six months, from December 2022 to June 2023. As per pair trading, an investor following the stocks would enter into a trade buying the shares of ICICI bank in January when the prices are out of sync and then would be interested in selling the shares back in March, expecting the share price of the ICICI bank to realign with the HDFC bank stock price.
Example #3
Floating Point Group (FPG) and ML Tech have partnered to offer institutional investors access to cutting-edge statistical arbitrage strategies. These strategies utilize advanced statistical models and historical data to identify and capitalize on temporary price discrepancies in a risk-controlled manner. The collaboration provides seamless access and monitoring of ML Tech's algorithmic trading strategies within FlowVault. It ensures a secure and efficient trading experience for institutional investors seeking to leverage statistical arbitrage in cryptocurrency.
Risks
The risks of statistical arbitrage are -
- The employed model may not accurately predict market behavior.
- A power outage or technical malfunction can cause an enormous loss of time and data.
- Data inaccuracy can bring blunders to the outcome as the model depends on historical data and price movement patterns.
- In statistical arbitrage trading strategies, there is also a liquidity risk when no counterparty is present to trade with a contrary position. So if there is no trading party, the constant buying and selling of portfolios is impossible.
- Many inefficiencies are captured, especially in the high-frequency trading process. So there is a risk of shorting an overvalued stock and taking a long position on the undervalued stock.
- Not using a suitable model can bring adverse results and affect the gap of price discrepancies.
Disclosure: This article contains affiliate links. If you sign up through these links, we may earn a small commission at no extra cost to you.

Frequently Asked Questions (FAQs)
Yes, it is widely used by investment banks and hedge funds. Since it is profoundly quantitative and requires a computational approach to securities trading, many banks have their operations centered around the technique of statistical arbitrage. It is a substantial part of the finance industry.
In options trading, statistical arbitrage generates profit from the price gap between the options' implied volatility and the forecasted volatility of the underlying securities. The option value is directly proportional to the volatility value and denotes the difference between the expected price and the option's market price.
While arbitrage does not guarantee a profit, it offers opportunities to capitalize on temporary price discrepancies in the market. Traders who can quickly identify and act on these opportunities can earn profits. Skilled arbitrageurs can increase their chances of achieving successful outcomes by carefully analyzing market conditions, minimizing transaction costs, and executing trades precisely.
Recommended Articles
This has been a guide to What Is Statistical Arbitrage. Here, we explain the topic along with its examples, types, and risks. You can learn more about it from the following articles –
