Table Of Contents
What Is A Standard Error Formula?
The standard error is the error that arises in the sampling distribution while performing statistical analysis. It is a standard deviation variant as both concepts correspond to the spread measures. A high standard error corresponds to the higher spreading of data for the undertaken sample.

Calculating the standard error formula is done for a sample. At the same time, the standard deviation determines the population. Thus, it measures the variability of the sample mean with relation to the population mean. The formula depends on some particular statistical parameter.
Key Takeaways
- It is a variant of standard deviation as both concepts capture measures of spread.
- A higher standard error indicates a greater spread of data within the sample. The standard error formula is applied to sample data, while the standard deviation estimates the population.
- The standard error of the mean for sample data is directly related to the standard deviation of the larger population and inversely related to the square root of the sample size.
Standard Error Formula Explained
Standard error formula is the measure of standard deviation of a sample population and it measures how accurately a sample distribution represents the entire population through the use of standard deviation. This deviation is the error.
In other words, it indicates how much the mean deviates from the accepted mean. It has been noticed that if the number of samples or data points is more, then the error tends to be less.
The formula tells us how much the sample statistics may move away from the actual parameter. The level of uncertainty of the reliability can be predicted using this formula. It plays an important role in any kind of statistical prediction. If the error is small, then it indicates that the estimate is more precise and less uncertain.
Formula
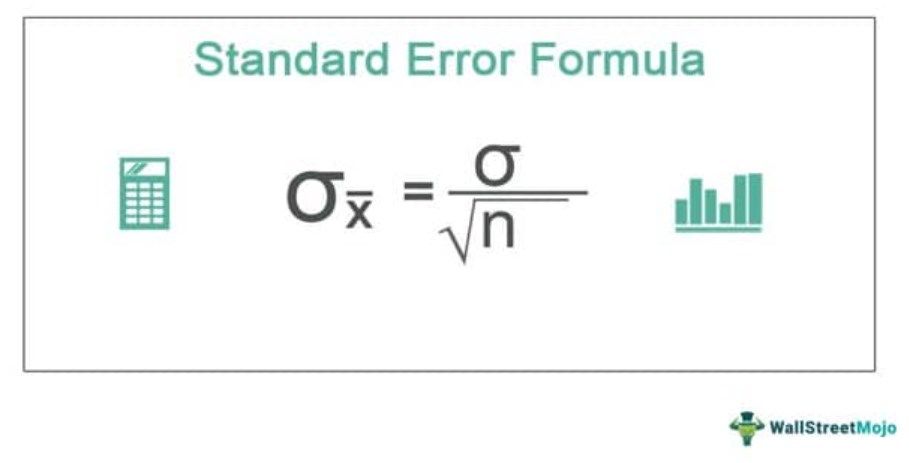
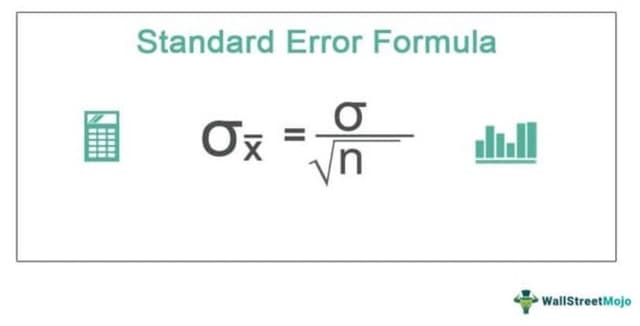
Therefore, a standard error on mean one would express and determine as per the relationship described as follows: –
Here,
- The standard error expressed as σ͞x.
- The standard deviation of the population is expressed as σ.
- The number of variables in the sample expressed as n.
In statistical analysis, mean, median, and mode are central tendency measures. The standard deviation, variance, and standard error on mean classifies as the variability measures. The standard error on mean for sample data is directly related to the standard deviation of the larger population and inversely proportional or related to the square root of several variables taken up for making a sample. Hence, if the sample size is small, then there could be an equal probability that the standard error would also be large.
How To Calculate?
One can explain the formula for standard error on mean by using the following steps:
Identify and organize the sample and determine the number of variables.
Next, the average means of the sample corresponds to the number of variables present in the sample.
Next, determine the standard deviation of the sample.
Next, determine the square root of the number of variables taken up in the sample.
Now, divide the standard deviation computed in step 3 by the resulting value in step 4 to arrive at the standard error.
The above details give the step-by-step process of calculation using the formula.
Example
Below are the formula examples for calculating standard error.
Example #1
Let us take the example of stock ABC. For 30 years, the stock delivered a mean dollar return of $45. In addition, one observed that the stock delivered returns with a standard deviation of $2. Help the investor to calculate the overall standard error on the mean returns offered by the stock ABC.
Solution:
- Standard Deviation (σ) = $2
- Number of Years (n) = 30
- Mean Dollar Return = $45
The calculation of standard error is as follows:

- σ͞x = σ/√n
- = $2/√30
- = $2/ 5.4773
The standard error is,

- σ͞x =$0.3651
Therefore, the investment offers a dollar standard error on the mean of $0.36515 to the investor when holding the stock ABC position for 30 years. However, if the stock held for a higher investment horizon, then the standard error on the dollar means would reduce significantly.
Example #2
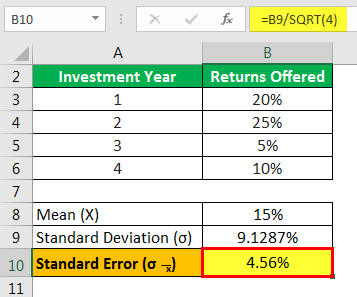
Let us take the example of an investor who has received the following returns on stock XYZ: –
| Investment Year | Return Offered |
|---|---|
| 1 | 20% |
| 2 | 25% |
| 3 | 5% |
| 4 | 10% |
Help the investor calculate the overall standard error on the mean returns offered by the stock XYZ.
Solution:
First, determine the average mean of the returns as displayed below: –

- ͞X = (x1+x2+x3+x4)/number of years
- = (20+25+5+10)/4
- =15%
Now, determine the standard deviation of the returns as displayed below: –

- σ = √ ((x1-͞X)2 + (x2-͞X)2 + (x3-͞X)2 + (x4-͞X)2) / √ (number of years -1)
- = √ ((20-15) 2 + (25-15) 2 + (5-15) 2 + (10-15) 2) / √ (4-1)
- = (√ (5) 2 + (10) 2 + (-10) 2 + (-5) 2 ) / √ (3)
- = (√25+100+100+25)/ √ (3)
- =√250 /√ 3
- =√83.3333
- = 9.1287%
Now, the calculation of standard error is as follows,

- σ͞x = σ/√n
- = 9.128709/√4
- = 9.128709/ 2
The standard Error is,

- σ͞x = 4.56%
Therefore, the investment offers a dollar standard error on the mean of 4.56% to the investor when holding the stock XYZ position for 4 years.
Standard Error Formula In Excel
Now, let us take the excel example to illustrate the concept of the standard error formula in the Excel template below. Suppose the school administration wants to determine the standard error on mean on the height of the football players.
The sample comprises of following values: –

Help the administration assess standard error on mean.
Step 1: Determine the mean as displayed below: –

Step 2: Determine the standard deviation as displayed below: -

Step 3: Determine the standard error on mean as displayed below: -

Therefore, the standard error on the mean for football players is 1.846 inches. The management should observe that it is significantly large. Therefore, the sample data taken up for the analysis is not uniform and displays a large variance.
The management should either omit smaller players or add significantly taller players to balance the football team's average height by replacing them with individuals with smaller heights compared to their peers.
Use
The standard error tends to be high if the sample size for the analysis is small. Therefore, a sample is always taken from a larger population, which comprises a larger size of variables. It always helps the statistician determine the sample mean's credibility concerning the population mean.
A large standard error tells the statistician that the sample is not uniform concerning the population mean. There is a significant variation in the sample concerning the population. Similarly, a small standard error tells the statistician that the sample is uniform concerning the population mean. There is no or minor variation in the sample concerning the population.
One should not mix it with the standard deviation. Instead, one should calculate the standard deviation for the entire population. The standard error, on the other hand, is determined for the sample mean.
Standard Error Formula Vs Standard Deviation Formula
Both the above topics measure the variability but the purpose of both are different. Let us understand the differences between them.
- The former measures the precision of a statistical estimate whereas the latter measures the dispersion or the spread of a set of data.
- The former measures the uncertainty of the estimate and can be used to infer results from the parameters, whereas the latter indicates to what extent the data or the result moves away from the actual result.
- The former describes the variability for multiple samples and the latter describes the variability from a single sample.

