Table Of Contents
What Is A Spinning Top Candlestick Pattern?
A spinning top candlestick can be defined as an asset price movement pattern where the candlestick has a short real body positioned between long upper and lower shadows. The opening and closing prices of the particular asset should be equal or at least closer, regardless of which one is higher.

A spinning top is created when bulls in the market push the price higher while the bears push the price lower. It leads to neither of the parties gaining from the asset. Therefore, a spinning top signals indecision regarding the stock's future price movements.
Table of contents
- What Is A Spinning Top Candlestick Pattern?
- A spinning top candlestick refers to an asset price movement where the opening and closing prices are equal or closer on a particular day due to bearish and bullish forces acting on the asset.
- The candlestick's short body indicates the little difference between opening and closing prices. But it has long upper and lower shadows showing the wide range of fluctuating prices within a day.
- All this signals uncertainty over the future direction of asset prices. The candlestick could either go sideways or reverse.
Spinning Top Candlestick Pattern Explained
Spinning top candlestick patterns are indicative of market uncertainty regarding future price movements. They emerge when bullish and bearish forces, speculating on price rise and decline, respectively, are evenly matched, resulting in a minimal net price change. Consequently, the opening and closing prices remain very close, forming a short real body within the candlestick.
Long upper and lower shadows in a spinning top represent the day's highest and lowest prices, but the asset ultimately closes near its opening price. It signifies that the price fluctuations throughout the trading session were inconsequential, reflecting market indecision regarding the asset's future direction.
A spinning top can lead to two potential outcomes: a sideways trend or a price reversal. The asset fluctuates within established support and resistance levels in a sideways or horizontal trend, failing to move significantly higher or lower. It allows buyers and sellers to continue their usual trading activities, forming a new spinning top.
A spinning top can signal a price reversal, though confirmation is crucial. For instance, if a bearish spinning top candlestick forms at the top of an uptrend, it suggests that bears are gaining control and the bullish momentum is waning. Conversely, a bullish spinning top candlestick at the bottom of a downtrend implies that bears may lose their grip, and bulls could take charge.
However, traders should exercise caution and seek confirmation from subsequent candlestick patterns to validate the anticipated price reversal. Following an uptrend or downtrend, a single spinning top alone may not sufficiently confirm a reversal.
How To Trade?
Trading stocks by looking at spinning tops helps decide when an investor should buy or sell. It allows them to understand the market's outlook. Also, some traders invest in derivatives and speculate on the price movements of underlying assets.
Regardless of an investor's option, one must remember that confirmation is critical. Investors should only take action after confirming the pattern if it is a horizontal trend or a price reversal. Traders can use technical and financial tools, like moving average convergence-divergence, relative strength index, etc.
Further, traders can also use the support and resistance levels in decision-making. Especially with derivatives, hedging can go a long way in managing the risk and protecting traders from losses. Nevertheless, a spinning top can yield losses despite confirmation if the desired pattern doesn't continue. Therefore, investors must fully understand the risks associated.
Chart And Interpretation
Let us look at this Tata Elxsi price chart to understand this candlestick pattern better.

As one can observe, the formation of the first spinning top candlestick occurred on May 31, 2018. Typically, it indicates indecision in the market as neither the buyers nor the sellers dominate the trading session. This means the candlestick may indicate neutral movements. That said, this pattern can also signal potential trend trend reversals. If such patterns appear at the end of a downtrend, it may mean that an uptrend is on the horizon. On the other hand, if this pattern forms at the end of an uptrend, it means a downtrend might be forthcoming. That said, the reversal is significantly dependent on the confirmation, which the next candle in the chart provides.
In this case, we see the formation of a larger bearish candle after the red spinning top candlestick. If traders had considered this a confirmation of a reversal, then they could have made financial gains from the downside move that materialized over the next couple of trading sessions.
To look at similar charts that can help provide a better understanding regarding this type of candlesticks, individuals can consider visiting the TradingView website. It has multiple charts showing how this pattern works.
Examples
Here are a few examples to understand the concept better.
Example #1
Consider XYZ stock, rising from $50 to $70. On Day 1, it opens at $70 and closes at $71, with highs at $73 and lows at $68, forming a spinning top. Day 2 sees an opening at $71, closing at $70, while fluctuating between $69 and $72, creating another spinning top. These patterns signal uncertainty as buyers and sellers vie for control, possibly indicating a weakening bullish trend and potential reversals or sideways movements ahead. Traders seek confirmation from subsequent patterns or indicators before acting on such signals.
Example #2
Below is an example of Apple's stock price from October 2022 to April 2023.
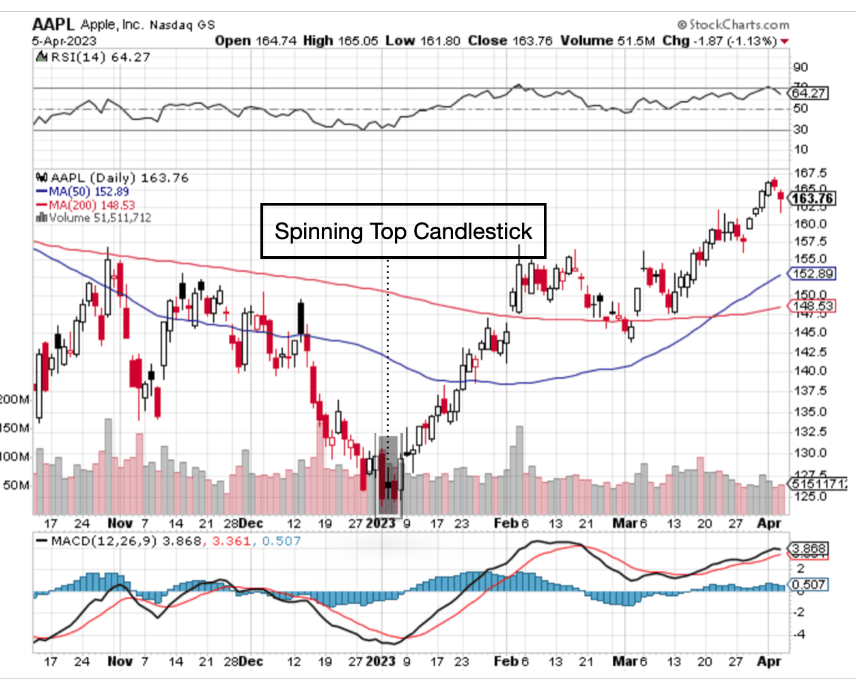
Note the highlighted portion starting in January 2023. The second candlestick indicated by dotted lines is a spinning top due to its shorter real body and long upper and lower shadows. The first candlestick in the highlighted portion is bearish. The spinning top candlestick could signal a possible reversal as the bulls have taken over and maintained the price level. However, the third candlestick doesn't confirm a reversal since the close is higher than the open.
Example #3
The GBP/USD currency pair, also known as the Cable pair, has followed a downward trend from February 2023 to the second week of March. On March 08, a bullish spinning top appeared, creating hopes of a corrective bounce. However, there was no confirmation the next day. One reason could be the downbreak of an ascending trend line since November 2022, which sustains the support level at 1.1935. Another reason could be the bearish moving average convergence divergence. Even if the 1.1935 mark is crossed, a resistance level of 1.2055 could defend the movement.
Spinning Top Candlestick vs Doji
While spinning top and doji candlestick patterns are used in technical analysis to assess market sentiment and potential reversals, they exhibit distinct characteristics that traders rely on for precise interpretation.
- A spinning top candlestick has a relatively larger body compared to a doji. A doji, on the other hand, is characterized by a tiny body, often resembling a cross.
- The body should be greater than 5% of the candle's length for a spinning top candlestick. In contrast, a doji is identified when the body is less than 5% of the candle's length.
- Spinning top candlesticks typically have longer upper and lower shadows compared to dojis.
For professional-grade stock and crypto charts, we recommend TradingView – one of the most trusted platforms among traders.
Disclosure: This article contains affiliate links. If you sign up through these links, we may earn a small commission at no extra cost to you.

Frequently Asked Questions (FAQs)
A red spinning top represents a bearish candlestick pattern characterized by an opening price that exceeds the closing price. Nevertheless, it's essential to emphasize that regardless of color, the disparity between the opening and closing prices is usually insignificant in a spinning top.
The hammer candlestick lacks an upper shadow and has a small body at the top of the candle, resembling a hammer's head. In contrast, a spinning top has both upper and lower shadows and a larger body. A hammer candlestick typically signals a bullish reversal, while a spinning top suggests indecision rather than a clear directional bias.
Yes, a spinning top candlestick pattern can indicate the potential for a price reversal in the financial markets. However, traders must exercise caution and not rely solely on the spinning top's signal. Confirmation from other technical indicators or subsequent candlestick patterns is often sought to validate the direction of the potential reversal before making trading decisions.
Recommended Articles
This article has been a guide to what is a Spinning Top Candlestick. Here, we explain the concept along with its examples, comparison with doji, and how to trade it. You may also find some useful articles here -
