Table Of Contents
What Is Semivariance?
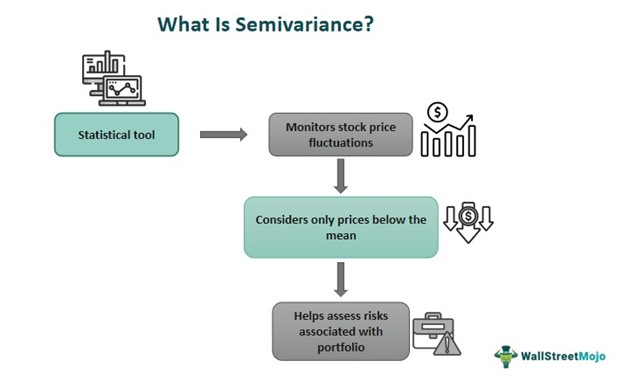
Semivariance refers to the statistical measure in which the stock price fluctuations are traced to record the prices below the mean or average level, enabling market players and analysts to figure out the risks associated with particular investments. This approach provides valuable insights into the magnitude of downside risk and helps with risk management and portfolio optimization.
It represents the dispersion of observations in a data set, similar to variance. Mathematically, it calculates the mean of all the squared values of all the deviations falling below the target value or mean in a dataset. Spreadsheet programs are also used in determining the semivariance of an investor's portfolio. It is an extended form of variance and standard deviation.
Key Takeaways
- Semivariance is the gauging indicator of dispersion observed within the dataset to predict the potential risk factor.
- It does not consider the values above the average mean of the data and hence only accounts for dispersion below the target value.
- Investors employ it to assess the downside risk of a portfolio and hence is associated with risk aversion behavior and strategy.
- It differs from variance, which considers the overall spread of the observations, i.e., both positive and negative fluctuations beyond the mean or average value to determine the market volatility.
Semivariance Explained
Semivariance is a statistical measure that represents the dispersion among the observations in a dataset. It specifically focuses on observations below the average mean to predict the potential average risk in an investor’s portfolio. In any active market session, the stock prices typically move in a price bracket; they do not exhibit extreme volatility and form a data set of multiple price fluctuations or observations for statistical calculations.
Datasets have an average mean value, calculated as the sum of all the observation values divided by the total number of observations. The mean represents the midpoint of a data set or average stock price. Semivariance considers only those stock prices that fall below the average stock price, also known as negative stock prices, to deduce the potential average risk an investor may come across if they have the underlying stock in their portfolio. Similarly, it can determine the potential risk of the entire portfolio.
There are many other measuring indicators in the stock market parallel to semivariance, such as variance, covariance, or standard deviation. Each has its purpose and application and caters to different aspects of the dataset. Semivariance only accounts for negative prices because it is focused on risk aversion. Investors can make smart investment decisions based on semivariance values or take short positions at the right time. However, it does not guarantee any predictions, and an investor must trade as per their risk tolerance and use multiple indicators for analysis.
Formula
The mathematical expression that helps in the semivariance calculation is mentioned below:
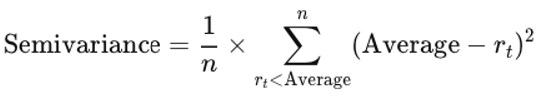
Here,
- n - number of observations falling below the average
- rt - observed value falling below the average
- Average - the average of the data set (target value)
Examples
Here are two examples to help one understand the semivariance definition even better:
Example #1
Suppose a banking stock is currently trading at the price of $33. The price range of the stock is between $27 to $45. The average stock price of the banking stock is $36. Rachel, as an investor, seeks to calculate the semivariance for this stock. She only considers the observational prices that are below $36. If there are more negative prices than positive, it also indicates that the stock is declining in price.
Rachel would have deduced the underlying stock's volatility had she considered the positive price values. She is a risk-averse investor, and semivariance can help her in optimal portfolio allocation. By applying the values in the formula, Rachel can make informed investment decisions regarding the banking stock.
Given:
- Average stock price = $36
- Lowest observed price = $27
- Number of observations recorded below the average = 36 - 27 = 9
Using the formula:
= 81/9 =9
Example #2
A recent study indicated how semi-variance emerged as an effective tool in exploring the relationship between crude oil prices and the stock market of the G5 nations amidst the Russia-Ukraine war. Both positive and negative results were studied to check on this spillover effect. In this observation, an asymmetric connection was found to exist between the two factors in question, i.e. the oil prices and the stock markets of those specific nations. The study advocated that this link would supposedly impact the portfolio hedging strategies significantly.
The findings also indicated that the level of resistance to this negative influence on the market was much better during the COVID-19. Thus, investors and policymakers must consider this negatively changing market environment seriously and limit their dependency on energy supplies from Russia.
Semivariance vs Covariance vs Variance
Let us understand the differences between these three concepts.
| Semivariance | Covariance | Variance |
|---|---|---|
| It defines below-average fluctuations of a data set | It elaborates on the relationship between two random variables | It depicts the whole spread of observations around the average mean. |
| In stock price analysis, it only considers the negative prices | It defines the direction of the stock through prices in stock price analysis | It considers both positive and negative stock prices concerning the average mean price in stock price analysis |
| It detects the potential average risk of a portfolio or underlying asset | It explains the price movement of two or more stocks | It determines the price range in which the stock is trading, all concerning the average mean. |
| It is concerned with risk aversion in an investor's portfolio | It is more focused on the direction of stocks' price movement | It showcases the volatility of data or stock prices in the market. |
