Table Of Contents
What Is Semi-Deviation?
Semi-deviation is a risk measurement metric to assess the downside volatility in an asset's price or return on investment. Hence, it is an alternative gauge to the standard deviation. Semi-deviation is used as a risk measure to assess and manage downside risk more effectively.
It can be applied to identify and compare the risk profile of various investment products based on their past performances. Thus, this method calculates the standard deviation of only the negative returns or below a certain threshold. Moreover, it is beneficial for risk-averse investors who are more concerned about the possibility of losses than overall volatility.
Table of contents
- Semi-deviation is an alternative measurement tool used in portfolio management to assess downside volatility. This enables assessing the risk involved in an asset or investment product by gauging the downside fluctuation in its price or returns.
- If the volatility is high at the downside price points, then such an investment involves significant risk and chances of potential loss. However, low volatility signifies that the asset has a low-risk profile.
- It is an alternative to standard deviation, a comprehensive measure of an asset's upside and downside volatility.
Semi-Deviation Explained
Semi-deviation refers to a measurement tool that quantifies the dispersion of returns below the mean and thus assesses downside volatility. While standard deviation considers positive and negative variations from the mean, semi-deviation only considers negative deviations or downside volatility.
Therefore, the downside semi-deviation measures the volatility or dispersion of negative returns below the specified threshold. Moreover, focusing on the volatility of returns below a specified threshold or target return evaluates the likelihood of experiencing negative returns. Besides, it's vital to note that annualizing semi-deviation assumes that the distribution of returns remains consistent over time, which may only sometimes hold.
Economists Harry Markowitz and A.D. Roy introduced it in the 1950s. He signifies this measure as the metric for risk measurement in portfolio management to protect investors from significant risk exposure. Markowitz devised the tool such that every portfolio secures the expected return at a given variance or downsizes the variance to match the expected returns. He suggested employing averages, variances, and covariances of asset return distributions. Furthermore, he also proposed the utility function to capture investor risk preferences.
Hence, by setting the target semi-deviation, investors can align their investment decisions and risk management strategies to achieve their desired risk-return tradeoff.
Such a measure is helpful for investors who are particularly concerned about the downside risk of an investment, especially those with a low tolerance for losses. By explicitly focusing on negative returns, this metric provides a more tailored measure of risk for such individuals. Thus, this measure allows for a more precise evaluation of the risk of losses, which can aid in:
- Decision-making
- Risk management
- Portfolio construction
- Performance evaluation
Formula
The semi-deviation formula used in the risk assessment of a potential investment is as follows:
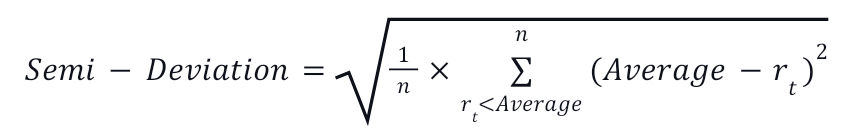
Where n represents the total number of observations lower than the average;
rt - it is the value observed; and
Average signifies the dataset's target value or mean.
Examples
Let us now understand semi-deviation with the help of the following illustrations:
Example #1
Suppose a mutual fund has provided the following returns since its inception:
| Year | Return % |
|---|---|
| 2013 | 14% |
| 2014 | 15% |
| 2015 | 17% |
| 2016 | 12% |
| 2017 | 13% |
| 2018 | 16% |
| 2019 | 15% |
| 2020 | 14% |
| 2021 | 18% |
| 2022 | 19% |
If the target return desired by an investor is 15%, let us determine the downside semi-deviation risk of the fund.
Solution:
| Year | Return % | Deviation from Target Return (15%) | Squared Deviations of Below-Target Return |
|---|---|---|---|
| 2013 | 14% | -1% | 1 |
| 2016 | 12% | -3% | 9 |
| 2017 | 13% | -2% | 4 |
| 2020 | 14% | -1% | 1 |
| Total | 15 |
= 1415 = 1.936%
While the downside fluctuation is insignificant, such a mutual fund is less volatile on the lower side.
Example #2
Suppose a stock's monthly returns per share in the past 12 months were as follows:
| Month | Return $ |
|---|---|
| June 2022 | $9.7 |
| July 2022 | $4.5 |
| August 2022 | $7.8 |
| September 2022 | $2.3 |
| October 2022 | $0.6 |
| November 2022 | -$1.7 |
| December 2022 | -$2.3 |
| January 2023 | $0.7 |
| February 2023 | $1.3 |
| March 2023 | $5.2 |
| April 2023 | $9.3 |
| May 2023 | $9.9 |
| Total | $47.3 |
| Average | $3.94 |
Let us determine the downside variation of the returns from the average.
Solution:
| Month | Return $ | Deviation from Target Return ($3.94) | Squared Deviations of Below-Target Return |
|---|---|---|---|
| June 2022 | $9.7 | 5.76 | 33.17 |
| July 2022 | $4.5 | 0.56 | 0.31 |
| August 2022 | $7.8 | 3.86 | 14.89 |
| September 2022 | $2.3 | -1.64 | 2.68 |
| October 2022 | $0.6 | -3.34 | 11.15 |
| November 2022 | -$1.7 | -5.64 | 31.80 |
| December 2022 | -$2.3 | -6.24 | 38.93 |
| January 2023 | $0.7 | -3.24 | 10.49 |
| February 2023 | $1.3 | -2.64 | 6.96 |
| March 2023 | $5.2 | 1.26 | 1.58 |
| April 2023 | $9.3 | 5.36 | 28.72 |
| May 2023 | $9.9 | 5.96 | 35.52 |
| Total | $47.3 | - | 216.2 |
= 112216.2 = $4.24
Since the downside variation in the stock return is high, it is a highly volatile and risky investment.
Semi-Deviation vs Standard Deviation
Semi-deviation and standard deviation are different measures used in finance and investment analysis for stock volatility or risk assessment. While the choice between these measures depends on the specific requirements and preferences of the analyst or investor, the following are some of the significant points of comparison between the two:
| Basis | Semi-Deviation | Standard Deviation |
|---|---|---|
Meaning | Semi-deviation evaluates the volatility of data points that fall below a predefined threshold. | Standard deviation quantifies the overall volatility or risk associated with a dataset. |
Measures | The potential risk of an investment or portfolio when the asset price or return falls beyond the minimum threshold | Dispersion of data points around the mean, providing insight into the extent of their variation, thus providing a picture of potential risk and return of an investment or portfolio |
Completeness | These are more commonly used metrics, offering a broader understanding of risk and return profiles. | Comprehensive assessment of positive and negative variations from the mean, I.e., potential return and risk involved in an asset |
Usefulness | This measures usage is subjected to gauge an asset's worst-case performance. | These are more commonly used metric, offering a broader understanding of risk and return profiles. |
Frequently Asked Questions (FAQs)
The semi-deviation is a modified version of the standard deviation used for risk assessment in portfolio management to identify only the downside or negative variation of the price or return of an asset. It is the semivariance's positive square root. However, the semivariance estimates the squared deviation of the returns from the mean.
This measure can be used in portfolio management to assess and manage downside risk. By incorporating semi-deviation into the portfolio construction process, investors can identify investments or assets with lower semi-deviation to reduce potential losses. It helps optimize the risk-return tradeoff and construct portfolios that align with the investor's risk tolerance and objectives.
Yes, it can compare the downside risk of different investments or portfolios. By comparing their semi-deviation values, investors can gain insights into which options have lower downside risk and make more informed decisions.
Recommended Articles
This article has been a guide to what is Semi-Deviation. Here, we explain its formula, examples, target and compare it with standard deviation. You may also find some useful articles here -
