Table Of Contents
Formula to Determine Sample Size of Population
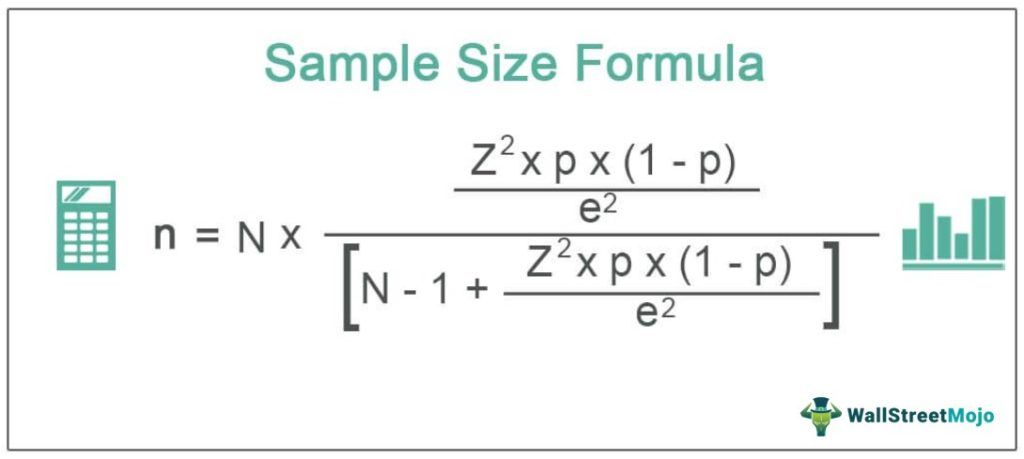
The sample size formula helps calculate or determine the minimum sample size, which is required to know the adequate or correct proportion of the population, along with the confidence level and the margin of error.
The term “sample” refers to the portion of the population that enables us to draw inferences about the population. So, the sample size must be adequate to make meaningful inferences. In other words, it is the minimum size needed to estimate the true population proportion with the required margin of error and confidence level. As such, determining the appropriate sample size is one of the recurrent problems in statistical analysis. Its equation can derive using population size, the critical value of the normal distribution, sample proportion, and margin of error.
Sample Size n = N * /

where,
- N = Population size,
- Z = Critical value of the normal distribution at the required confidence level,
- p = Sample proportion,
- e = Margin of error
Key Takeaways
- The sample size formula determines the minimum sample size, which is a must to understand the adequate or correct proportion of the population, the confidence level, and the margin of error.
- Understanding the appropriate sample size is essential since one may use it to validate research findings.
- The equation can be obtained utilizing population size, the normal distribution critical value, sample proportion, and margin of error.
- If the sample size is small, it will not create an appropriate outcome, while a sample that is too large will be both a money and time waste. Hence, one must consider a reasonable sample size for market research, healthcare, and education surveys.
How to Calculate Sample Size? (Step by Step)
- Step 1: Firstly, determine the population size, which is the total number of distinct entities in your population, and it is denoted by N.
- Step 2: Next, determine the critical value of the normal distribution at the required confidence level. For example, the critical value at 95% confidence level is 1.96.
- Step 3: Next, determine the sample proportion which can be used from previous survey results or be collected by running a small pilot survey.
- Step 4: Next, determine the margin of error, the range in which the true population expects to lie.
- Step 5: Finally, the sample size equation can derive by using population size (Step 1), the critical value of the normal distribution at the required confidence level (Step 2), sample proportion (Step 3), and margin of error (Step 4) as shown below.

Examples
Example #1
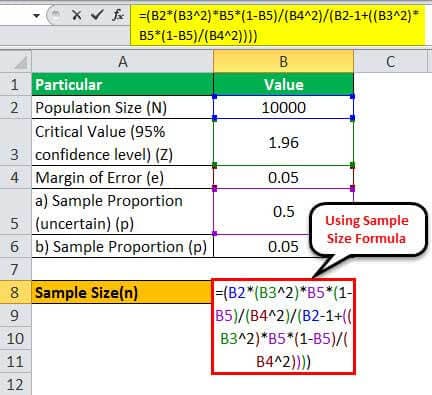
Let us take the example of a retailer who is interested to know how many of their customers bought an item from them after viewing their website on a certain day. Given that their website has, on average, 10,000 views per day, determine the sample size of the customers that they have to monitor at a 95% confidence level with a 5% margin of error if:
- They are uncertain of the current conversion rate.
- They know from previous surveys that the conversion rate is 5%.
Given,
- Population size, N = 10,000
- Critical value at 95% confidence level, Z = 1.96
- Margin of error, e = 5% or 0.05
1 – Since the current conversion rate is unknown, let us assume p = 0.5

Therefore, one can calculate the sample size using the formula,

= (10,000 * (1.96 2)*0.5*(1-0.5)/(0.05 2)/(10000 - 1+((1.96 2)* 0.5*(1-0.5)/(0.05 2))))

Therefore, 370 customers will be adequate for deriving meaningful inferences.
2 – The current conversion rate is p = 5% or 0.05
Therefore, one can calculate the sample size using the above formula,

= (10,000 * (1.96 2)*0.05*(1-0.05)/(0.05 2)/(10000 - 1+((1.96 2)* 0.05*(1-0.05)/(0.05 2))))

Therefore, a size of 72 customers will be adequate for deriving meaningful inferences in this case.
Example #2
Let us take the above example. Let us assume that the population size, i.e., daily website view, is between 100,000 and 120,000, but the exact value is unknown. However, the rest of the values are the same, with a conversion rate of 5%. Therefore, calculate the sample size for both 100,000 and 120,000.
Given,
- Sample proportion, p = 0.05
- Critical value at 95% confidence level, Z = 1.96
- Margin of error, e = 0.05

Therefore, one can calculate the sample size for N = 100,000 as,

= (100000 * (1.96 2)*0.05*(1-0.05)/(0.05 2)/(100000 - 1+((1.96 2)* 0.05*(1-0.05)/(0.05 2))))

Therefore, one can calculate the sample size for N = 120,000 as,

= (120000 * (1.96 2)*0.05*(1-0.05)/(0.05 2)/(120000 - 1+((1.96 2)* 0.05*(1-0.05)/(0.05 2))))

Therefore, it proves that as the population size increases to be very large, it becomes irrelevant in the computation of the sample size.
Relevance and Uses
Sample size calculation is important to understand the concept of the appropriate sample size because one may use it to validate research findings. In case it is too small, it will not yield valid results, while a sample that is too large may be a waste of both money and time. Therefore, one should use a considerable sample size for market research, healthcare, and education surveys.

