Table Of Contents
What Is Sample Mean?
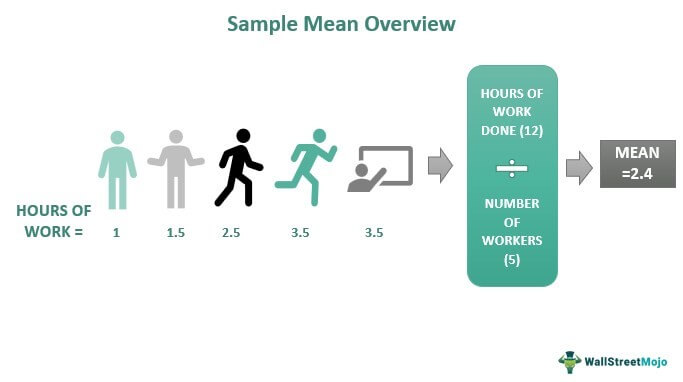
Sample Mean refers to the mean value of a sample of data calculated from within a large population of data. It is a good tool to assess the population mean if the sample size is large and the statistical researchers randomly take fragments from the population.
Statisticians and researchers use this Mean to calculate population distribution's variance, central tendency, and standard deviation. It is very effective in measuring a country's population average. Statisticians also use it to forecast the standard of the normalcy of a specific population under study. Finally, they use it for those populations whose Mean is unknown. Investors use it to understand stock performance.
Key Takeaways
- The average of all the sample data values is called the Sample mean. It is useful in gauging the mean and behavior of a population. For example, researchers use simple average mean widely to calculate the population averages of nations.
- One can find it using the arithmetic and geometric mean methods. The latter is more complex than the former. The arithmetic method divides the total data value in a sample by the total number of data sets.
- If the sample size is very large, the Mean is normal, and the standard deviation is known for a population. One will normally distribute the simple average of the sampling distribution.
- Population Mean is difficult to calculate as compared to sample average Mean.
Sample Mean Explained
The Sample Mean is the average mathematical value of a sample's values. It is a statistical indicator used to analyze various variables over time. Statisticians and researchers obtain it by dividing the total sum of values of all data fragments and then dividing it by the total number of data sets. Statistical researchers mathematically represent it as follows:
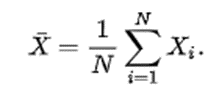
Where X̄ = Simple average or Mean
X = variable with different values, and
N= total number of variable observations.
In actual practice, the center of any number of data set is the Mean. However, surveying every individual or data set to get the population Means accurately is impossible. It becomes time-consuming, requires huge capital, and makes the work cumbersome. Also, the forecasting of population behavior and the assessment of the population is very important to making important decisions of policy. Hence, in such cases, simple average comes to our rescue. Also, statisticians and researchers further use the simple average to calculate the Sample mean variance and Sample mean standard deviation of the population.
For calculating the Mean, one has to select random data specimens multiple times and record the information in tabulated form. A sample is a smaller version of a large group. Once researchers record the data, they use each group of samples to find their respected random sample mean. These Means are very important to know about the behavior of a population.
Formula
Statistical researchers use the Mean formula to calculate the average value related to the presented sample datasets. So, they can find the arithmetic mean formula by dividing all the values of data sets by the total number of data sets.
Mathematically, the arithmetic Mean formula is represented as:
Simple average or Mean = Total of all the values of data sets / Total number of data sets.
= (a1+a2+a3+a4+a5+a6+………an) / N
= Sigma ai/N, where Sigma ai = total of all the values of data sets, and
N = total number of data sets
Geometric mean method produces approximately the same result but is more complex and complicated. It takes the nth root of a number after multiplications. The geometric mean formula is:
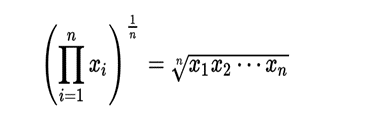
Where Π = Geometric Mean
n = Number of values
xi = Values to average
Calculation Example
Here is a calculation example to help understand the Mean or simple average concept better.
Let's assume a group of finance students learns about investment banking from a reputed college. The group consists of 6 students A, B, C, D, E, & F, who study for 5 hours, 4.5 hours, three hours, 1 hour, 2 hours, and 2.5 hours respectively. Now, let us find the simple average of study time devoted by this group of students.
Here is a table to represent the values.
| Students | Study hours requirement |
| A | 5 |
| B | 4.5 |
| C | 3 |
| D | 1 |
| E | 2 |
| F | 2.5 |
Hence for finding the simple average study time for the group, let us collect the relevant data as the following:
Total study time by the student's A, B, C, D, E, & F, T = 5 hours + 4.5 hours + 3 hours + 1 hour + 2 hours + 2.5 hours.
Or, T = 5+4.5+3+1+2+2.5 = 18 hrs.
Here, the total number of students = 6.
Mean by arithmetic method for study time, Smean = total of study time/number of students
= 18/6 = 3 hours
Or, Smean = 3 hours
The simple average by geometric method for study time, Smean = product study time (hours). Find the nth root of the products.
= 5*4.5*3*1*2*2.5 = 337.5 hours
The total number of students = n = 6
Finding the 6th root of 337.5 one gets = 2.6386
i.e., 3
Therefore, the simple average mean of study time is 3 hours.
Sampling Distribution Of Sample Mean
One can explain it as a situation when a given random specimen size n is repeatedly taken from a specified population with certain values related to a numeric variable having mu (μ) as the population mean. For example, if sigma (σ) is the population's standard deviation, then the Mean for all the Means (x-bars or X̅ ) will exactly represent the population mean mu (μ).
In other words, one can take the sampling distribution as the sample mean probability distribution which can attach sample statistics related to a specimen. Moreover, if one assumes that:
- X denotes the population having an average μ for its distribution along with standard deviation σ
- Researchers distribute X normally, and
- The Sample is very big.
Then the simple average mean X̅ will be distributed normally, having an average μ plus standard error as σ/ √n
It is important to note that:
- X is almost normal, or the sample size is very large.
- Standard deviation is known for the population.
Then only the sampling distribution of the average mean as depicted earlier is valid; otherwise not.
Sample Mean vs Population Mean
Here is a list highlighting some basic differences between the sample and population mean.
- The former is the average of all the values of the sample collected from a larger population to estimate the population.
- On the other hand, the population mean is the Mean of complete values contained in a population.
- The former is easy to calculate, whereas the latter is not.
- Population mean is more accurate than sample average.
