Table Of Contents
What Is Safety Stock?
Safety Stock is the additional quantities of goods stored as a safety net above the required amount to prevent going out of stock due to emergencies. An example of an emergency is when sold-off goods undergo damage to being delivered.
In such a case, safety stock can ensure that the customer receives the product regardless of the emergency. Companies bear additional costs of maintaining the extra stock to serve their customers well.
Key Takeaways
- Safety stock is the extra stock maintained to avoid the risk of losing customers because of having insufficient inventory due to unforeseen circumstances.
- We need to maintain the extra stock to ensure a consistent business flow and retain our customers. It requires companies to bear extra production and storage costs.
- There are many formulas to calculate safety stock. Each of them has some limitations, suitable for different scenarios.
Explanation
Businesses already forecast their inventory level based on demand and supply. Under normal circumstances, they will not run out of stock. Safety stock is also called buffer stock and is obtained above the normal forecasted level. Buffer stock is a mechanism to account for the uncertainty in demand and supply.
Uncertainties could be anything, such as a sudden hike in demand. Not having extra stock will lead a business to lose an opportunity. For instance, newly launched iPhones and PlayStations become out of stock because of low supply and high demand. Accidents, delays, floods, cyclones, landslides, or heavy snowfall directly impact the supply lines.
Safety Stock Formula
There are various formulas for the calculation of safety stock. Their suitability is based on stock volume variability, lead time variability, type of business, etc. Here we will look into two of these formulas.
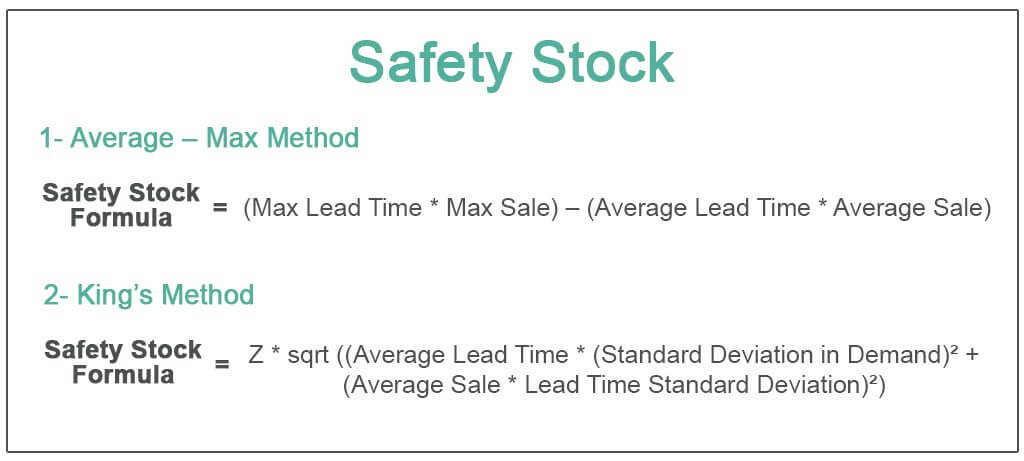
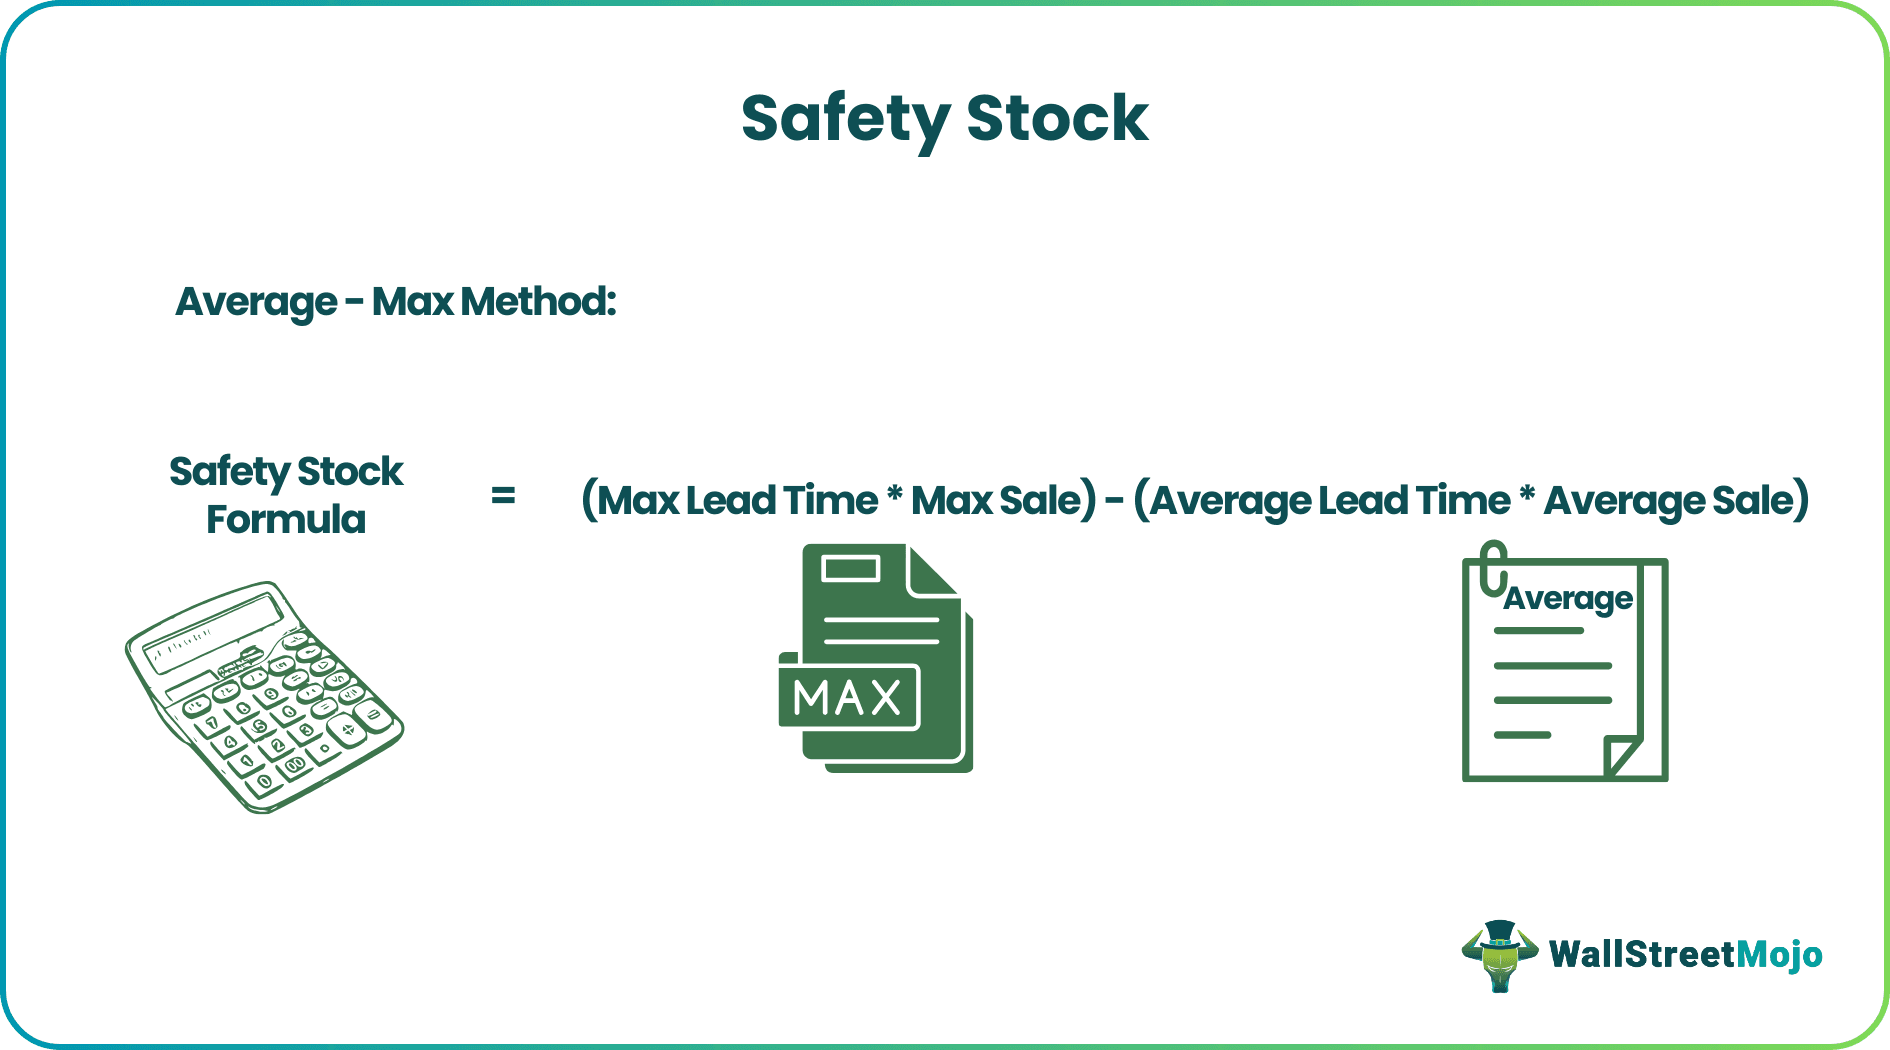
#1 - Average – Max Method
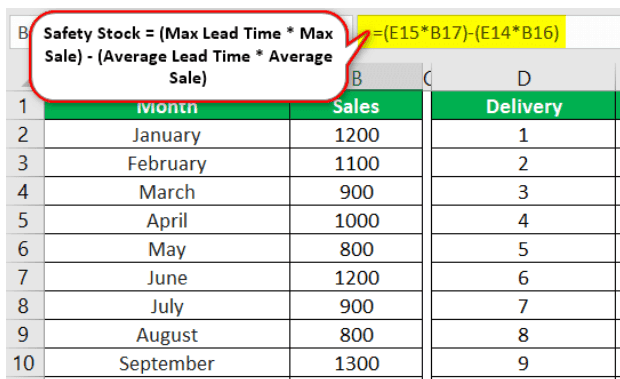
Safety Stock = (Max Lead Time * Max Sale) - (Average Lead Time * Average Daily Sale)
The basic calculation formula involves a couple of variables.
- Max sales = the day with the highest number of items sold.
- Average sales = average daily sales
- Lead time = in this contest, the lead time is the time period from the point a business places an order to restock its supplies until the supplier actually delivers them.
- The lead time is calculated in terms of days.
- Max lead time = the maximum number of days taken by the supplier to deliver the stock since placing its order.
We will take you a step further. Once you have the value of the buffer stock, you can use it to calculate the exact time at which you will need to place an order to restock your supplies. So, you reorder when the stock gets reduced to the reorder point. It is referred to as the reorder point.
Reorder Point = Safety Stock + Average Daily Sale (or Forecast) * Average Lead Time
#2 - King’s Method
The second one is more accurate, albeit more complex. However, the excel formula comes to our rescue.
Safety Stock = Z * sqrt {(Average Lead Time * (Standard Deviation in Demand) ² + (Average Sale * Lead Time Standard Deviation) ²}
This formula takes into account variations in demand and supply.
Step by Step Calculation Example
The following are examples of safety stock calculations.
#1 - Average – Max Method
The calculation of safety stock is -
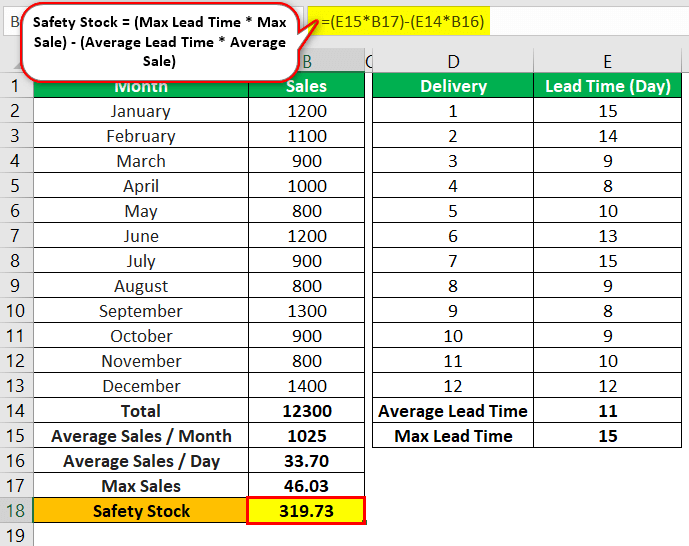
buffer stock formula = (Max Lead Time * Max Sale) - (Average Lead Time * Average Daily Sale)
Max Lead Time = As can be seen from the sheet, the maximum lead time taken was in January with 15 days.
Max Sale = The month of December had the maximum number of sales.
- Calculating maximum sales in day = 1400/30 = 46. 03
- Average Lead Time = 11
- Average Daily Sale = 33.70
Putting the numbers in the formula, we get the following -
Safety Stock = (15 * 46.03) – (11 * 33.70) = 319.73 ≈ 320 Units
The calculation of the reorder point will be -
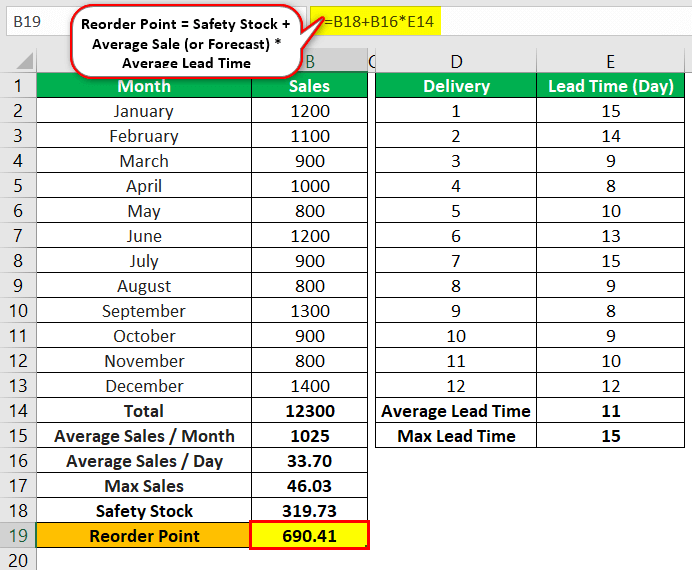
Reorder Point = 319.73 + 33.70 * 11 = 690.41 ≈ 690 Units
This formula is not very effective if the range of variability of sales volume or lead time is too large.
# 2 - King’s Method
The formula makes use of service level and normal distribution of data. Z represents the service level. Service level defines the expected probability of avoiding an out-of-stock problem before restocking the supplies. A 95% service level means that there may be a stockout in 5% of the cases. A high service level increases the business’s cost to avoid stockout, but many firms do it nonetheless.
The calculation of buffer stock based on King's Formula is described below.
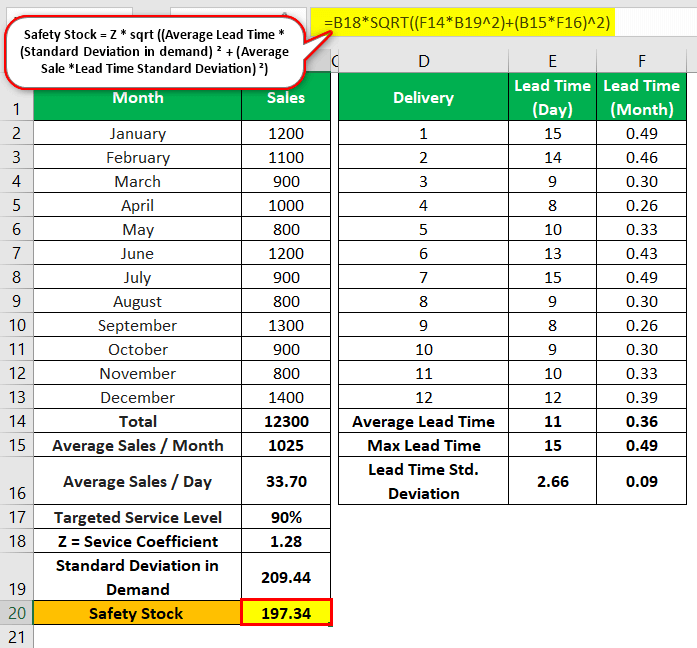
Buffer Stock = Z * sqrt {(Average Lead Time * (Standard Deviation in Demand) ² + (Average Sale * Lead Time Standard Deviation) ²}
1.28 * SQRT ((0.36 * 209.44^2) + (1025 * 0.09) ^2) = 197.34 ≈ 197 Units
Please note, we have used monthly lead time here in consideration of the monthly sales report.
Reorder Point
The calculation of the Reorder point will be -
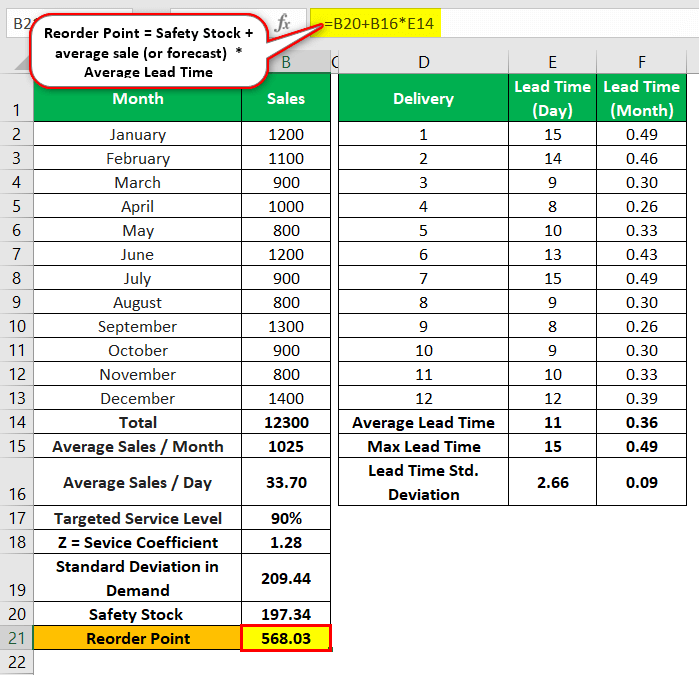
Reorder Point = 197.03 + 33.70 * 11 = 568.03 ≈ 568 Units
Why Do You Need Safety Stock?
- The simple answer is that we do not want to lose our customers because of the unavailability of products. Buffer stock protects us from inconsistency in demand and lead time or inaccurate forecasting. It helps us in the continuous flow of business.
- The pandemic happened out of nowhere. Hardly anyone was prepared for it. With shutdowns and lockdowns around the globe, factories were shut. Some warehouses had supplies, but they couldn’t be reached due to a large-scale lockdown between the states. Let's take the example of Covid-19, which heavily impacted supply chain management leading to a massive loss for the business class.
- Panic buying made things worse, with store shelves falling empty. With no business and massive demand, including difficulties reaching the warehouses, there was an enormous shortage of products to buy.
- As per a study, around 57% of the supply chains have faced a reduction of 25% or greater owing to Covid-19. The survey takers voted Sourcing & Procurement with 65%, the most affected by the supply chain disruption, followed by Warehouse & Distribution at 48%.
- As such, buffer stock helps meet the demand requirements when the supply chain is disrupted or when a supplier fails to deliver the supplies on time. For example, a bakery is waiting for its suppliers to deliver raw materials like milk, sugar, baking soda, chocolate, etc. If suppliers do not turn up, the bakery will fail to deliver baked goodies to its customers.
- There is a risk of customers heading to the competitor’s shop. If the bakery has maintained a buffer stock, it will manage for a day or two without disappointing its customers till its pantry gets restocked. Although we may not fully prepare for such a scenario, we can certainly try to mitigate the effects, which can be done by maintaining a buffer stock.

How to Maintain Safety Stock?
With continuous weather forecasting and Data Science progress, we are better prepared to make provisions for buffer stock. While dealing with this issue, we should keep the following factors in mind:
Do we really want to eliminate the risk of a stockout? At what cost?
Maintaining stocks already involves ordering costs, holding costs, and spoilage costs. Adding any buffer stock will further overburden a company.
If we do not maintain a buffer stock, we may lose our customers. Customers will buy a product from other stores if our shelves are empty. Most likely, they will not wait for our shelves to be replenished.
We need to balance keeping stock maintenance costs down while maintaining a certain amount of buffer stock appropriate for our business.
While managing a buffer stock, we should focus more on products showing inconsistency in consumption rate and lead time. Consistent patterns can be predicted better.
Not all goods need safety stock in equal measure. As inventory managers, we should identify the level of customers' disappointment over a product's unavailability. This information will help us grade the stocking requirements of different products.
