Table Of Contents
Rising Wedge Pattern Meaning
The rising wedge pattern is used in financial markets to identify potential trend reversals. It consists of converging trendlines that slope upward, with the lower trendline rising at a steeper angle than the upper one. This pattern suggests a potential bearish reversal, indicating that the asset's price may decline after a period of upward movement.

It aims to give traders and analysts insights into potential price reversals, helping them make informed decisions about entry and exit points. By recognizing the rising wedge pattern, traders can anticipate a shift from bullish to bearish sentiment and adjust their strategies accordingly. This pattern's importance lies in its ability to offer early warning signals, aiding traders in managing risk and maximizing profit potential during changing market conditions.
Table of contents
- Rising Wedge Pattern Meaning
- The rising wedge pattern signals a potential bearish reversal in an uptrend. It forms when converging trendlines slope upward, with the lower trendline steeper than the upper one.
- Traders watch for a confirmed breakout below the lower trendline as a signal to consider short positions. Increased volume during the breakout enhances its validity in a rising wedge pattern.
- Setting a stop-loss above the upper trendline and targeting a price projection based on the pattern's height are essential risk management actions of this rising wedge pattern technique.
Rising Wedge Chart Pattern Explained
The rising wedge pattern, an essential component of technical analysis, materializes within uptrends. It materializes through converging trendlines, portraying higher lows and higher highs. This configuration hints at a potential bearish reversal, signifying weakening bullish momentum.
Traders scrutinize breakout confirmations, contemplating short positions as the price breaks below the lower trendline. The amplified trading volume during this phase bolsters the pattern's credibility. Recognizing its limitations, traders consider overall market trends and other indicators to make well-informed decisions. The rising wedge pattern underscores the dynamic interplay of psychology and market forces, empowering traders to anticipate potential reversals and optimize their trading strategies.
Examples
Let us look at the examples to understand the concept better.
Example #1
Consider the Stock XYZ, which has enjoyed a sustained upward trajectory due to robust earnings and expanding market demand. Over time, a rising wedge pattern emerges on the stock's price chart. This pattern is characterized by a converging price range formed by a steeper lower trendline, which connects ascending lows, and an upper trendline that joins the sequence of higher highs.
Despite several attempts, stock XYZ struggles to breach the upper trendline, and its trading volume diminishes as the pattern evolves. Eventually, the stock breaks below the lower trendline with a noticeable uptick in trading volume. This development prompts traders to interpret the breakout as a potential indication of a shift in the prevailing trend.
Traders might opt for caution, possibly considering short positions or adjusting their existing strategies in anticipation of a potential price decline. By measuring the pattern's height and projecting it downward from the breakout point, traders estimate a potential target level for the expected downward movement.
Example #2
Consider that a stock's price has steadily increased over several weeks, and traders are bullish on its prospects. During this uptrend, a rising wedge pattern forms on the price chart. The stock's upper trendline connects the recent highs, while the lower trendline aligns with the rising lows but at a steeper angle.
As the stock trades within this pattern, its upward momentum begins to slow down, and the trading range between the trendlines becomes narrower. This indicates potential exhaustion in buying interest. Despite a few attempts to increase the price, the stock struggles to break above the upper trendline.
Traders who recognize this rising wedge pattern may interpret it as a warning sign of an impending trend reversal. Anticipating a possible downturn, they could consider reducing their bullish positions or taking short positions to profit from the anticipated price decline.
How To Spot?
Let us look at how to spot a rising wedge pattern on a price chart:

- Identify the Uptrend: Look for a clear and sustained uptrend in the price movement. A series of higher highs and higher lows characterize this.
- Draw Trendlines: Draw an ascending trendline connecting the higher lows, indicating the support level. Then, draw a second trendline connecting the higher highs, forming the resistance level.
- Converging Lines: Notice how the trendlines converge, with the lower trendline rising at a steeper angle than the upper one. This creates a narrowing price range resembling a wedge.
- Multiple Touches: Ideally, the price movement should touch both trendlines at least twice, confirming their significance.
- Decreasing Volume: Observe if the trading volume decreases as the pattern develops. This decline indicates diminishing interest and potential trend reversal.
Chart
Let us look at the EUR/USD chart to better understand the concept of rising wedge patterns.
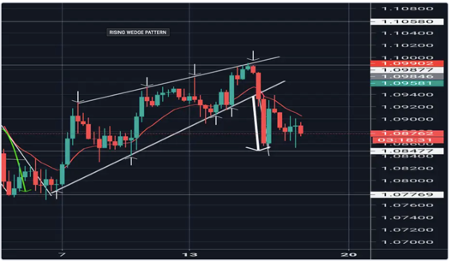
As we can observe in the above chart, the two converging trend lines connect the lows and highs over a period, leading to the formation of a rising wedge pattern. The pattern develops after an upward trend, indicating a potential bearish reversal. The confirmation of the drop in prices occurs when the breakout materializes below the trend line. At this point, traders could use a short-selling strategy to generate financial gains from the falling prices. For more such price charts showing a rising wedge pattern formation, individuals can look at more charts available on the TradingView platform. Observing this pattern in charts of different financial assets, like stocks and commodities, will help one develop a detailed understanding of this concept.
How To Trade?
Let us look at how to trade based on a rising wedge pattern:
- Confirmation: Wait for a confirmed breakout from the rising wedge pattern. A breakout occurs when the price moves below the lower trendline (support) or breaks above the upper trendline (resistance).
- Entry Points: If the breakout is bearish (price moves below the lower trendline), consider entering a short position. If the breakout is bullish (price moves above the upper trendline), look for potential long positions.
- Stop Loss: Place a stop-loss order above the breakout point for a bearish trade and below the breakout point for a bullish trade. This helps limit potential losses if the trade goes against your expectations.
- Target Price: Estimate a target price for trade based on the height of the wedge pattern. For a bearish trade, measure the height from the highest point of the pattern to the support line and project it downward. For a bullish trade, measure from the lowest point to the resistance line and project it upward.
- Risk Management: Determine position size based on risk tolerance and overall portfolio strategy. It's advisable not to risk more than a certain percentage of trading capital on a single trade.
- Monitoring: Keep a close eye on the trade as it progresses. If the price moves in favor, consider trailing stop-loss to lock in profits.
Breakout
In a rising wedge pattern, a breakout refers to a decisive price movement that occurs when the price of an asset breaks above the upper trendline (resistance) or below the lower trendline (support) of the wedge. This breakout indicates a potential shift in the prevailing trend and often serves as a key trading signal for traders and investors.
- Bearish Breakout (Below Support): If the price breaks below the lower trendline of the rising wedge pattern, the prior uptrend may weaken, and a potential trend reversal could be underway. Traders might consider initiating short positions or tightening their stop-loss levels on existing long positions.
- Bullish Breakout (Above Resistance): Conversely, if the price breaks above the upper trendline of the rising wedge, it could signal a continuation of the uptrend or a period of increased bullish momentum. Traders may explore opportunities for long positions or consider adding to existing positions.
In both cases, traders typically wait for confirmation of the breakout through increased trading volume and additional technical indicators. False breakouts, where the price briefly moves beyond a trendline before reversing, are a consideration, so confirmation is vital before executing trades based on the breakout.
Pros And Cons
Let us look at the pros:
- Early Reversal Indication: A rising wedge pattern can signal a potential trend reversal, allowing traders to adjust their positions ahead of a significant price movement.
- Clear Entry and Exit Points: The pattern's breakout points (above for bullish, below for bearish) offer distinct entry and exit levels, aiding traders in defining their trades and managing risk.
- Technical Confirmation: Breakouts often come with increased trading volume and other technical indicators, confirming the pattern's validity.
Let us look at the cons:
- False Breakouts: Breakouts from a rising wedge pattern can sometimes be false signals, leading to temporary price movements that reverse quickly, causing losses for traders who entered prematurely.
- Subjectivity: Identifying and interpreting patterns can involve subjectivity. Traders may have different opinions on whether a rising wedge pattern is forming.
Rising Wedge Pattern vs Falling Wedge Pattern
Let us look at the difference between a rising wedge pattern and a falling wedge pattern:
| Parameters | Rising Wedge Pattern | Falling Wedge Pattern |
|---|---|---|
| Shape | Converging trendlines that slope up | Converging trendlines that slope down |
| Interpretation | Potential bearish reversal | Potential bullish reversal |
| Breakout Direction | Downward (Bearish) | Upward (Bullish) |
| Trendlines | The lower trendline is steeper than the upper | The upper trendline is steeper than the lower |
| Price Movement | Higher highs and higher lows | Lower highs and lower lows |
Rising Wedge Pattern vs Ascending Triangle Pattern
Let us look at the differences between the Rising Wedge Pattern and the Ascending Triangle Pattern:
| Parameters | Rising Wedge Pattern | Ascending Triangle Pattern |
|---|---|---|
| Shape | Converging trendlines that slope up | Horizontal upper trendline, ascending lower trendline |
| Interpretation | Potential bearish reversal | Potential bullish continuation |
| Breakout Direction | Downward (Bearish) | Upward (Bullish) |
| Volume Confirmation | Higher volume on the breakout | Higher volume on the breakout |
| Trading Strategy | Consider short positions | Consider long positions |
| Stop Loss Placement | Above upper trendline for shorts | Below lower trendline for longs |
| Target Projection | Measure the height from upper to lower | Measure the height from base to upper |
For professional-grade stock and crypto charts, we recommend TradingView – one of the most trusted platforms among traders.
Disclosure: This article contains affiliate links. If you sign up through these links, we may earn a small commission at no extra cost to you.

Frequently Asked Questions (FAQs)
The rising wedge pattern can appear in various timeframes and markets, such as stocks, forex, commodities, and cryptocurrencies. It can occur in short-term intraday charts and longer-term daily or weekly charts. Regardless of the timeframe or market, the principles of identifying and trading the rising wedge pattern remain consistent.
Traders often combine the rising wedge pattern with other technical indicators like moving averages, oscillators, or trendlines from different timeframes. This approach provides a more comprehensive analysis, confirming or strengthening the signal from the rising wedge.
The duration of a rising wedge pattern can vary. Generally, the longer the pattern forms, the more significant it might be. A prolonged rising wedge could indicate a stronger potential reversal, suggesting a more prolonged battle between bulls and bears. Shorter-duration wedges might lead to shallower price reversals.
