Table Of Contents
What Is Relative Strength?
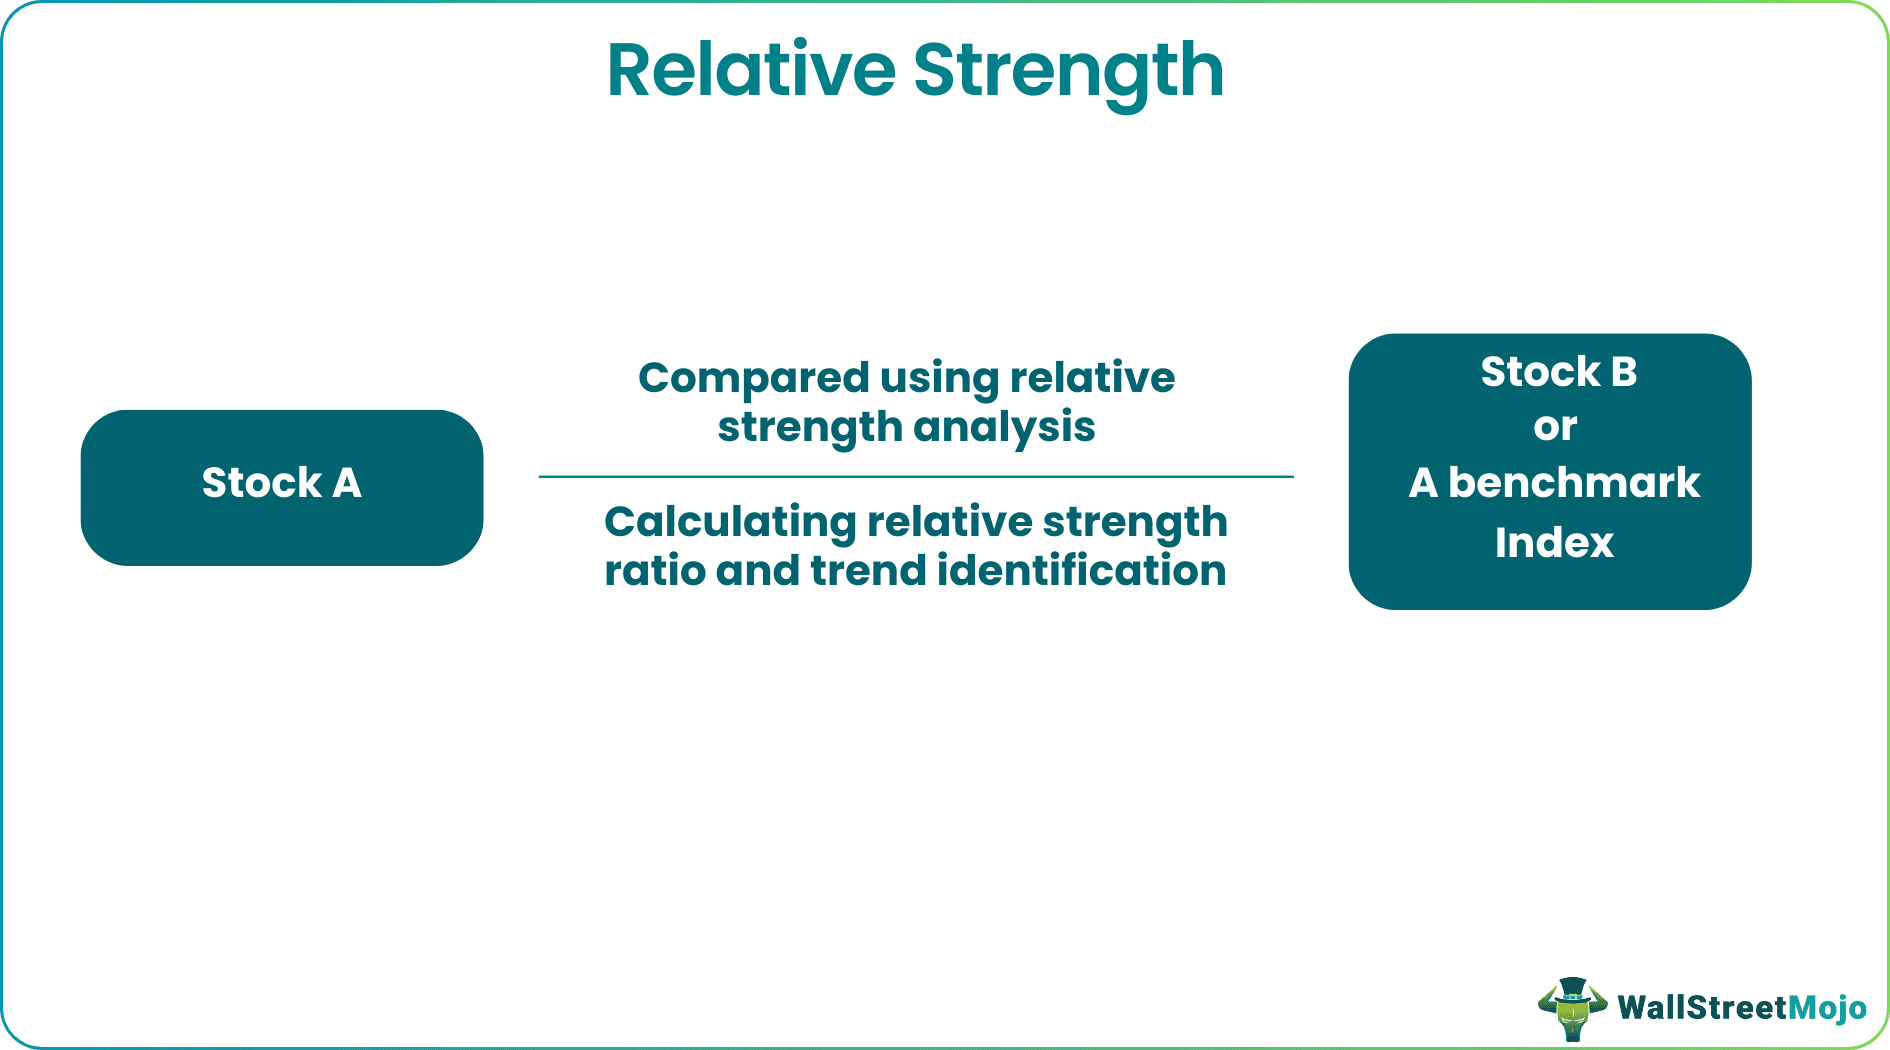
Relative strength is a financial analysis tool used to compare the performance of securities or assets to a benchmark index. Its analysis aims to identify securities or assets that outperform or underperform the benchmark index.
Relative strength analysis has significant importance in the financial industry. It provides investors with a tool to identify securities or assets that are performing well and have the potential for future growth. Identifying outperforming or underperforming securities or assets helps investors make informed investment decisions and potentially earn higher returns.
Table Of Contents
- What Is Relative Strength?
- Relative strength is a tool used in technical analysis to compare the price performance of one stock or asset to a benchmark, such as an index, over a given period.
- It measures the price of a security relative to a benchmark and helps identify which security is performing better or worse than the benchmark.
- The analysis based on this technique can be used to identify trends and potential investment opportunities in the financial markets. It can be a useful tool in making buy/sell decisions.
Relative Strength Explained
Relative strength is the measurement of the price trend of one security or asset relative to another, providing insight into the security's performance compared to its benchmark. Relative strength analysis is commonly used in various investment strategies, including momentum investing, which involves buying securities that have shown strong relative strength over a certain period. Additionally, the analysis can diversify an investment portfolio by selecting securities from different industries or sectors that outperform their benchmarks.
The process behind relative strength analysis involves several steps:
- First, identify the securities or assets to compare: The first step is to choose the securities or assets to compare. For example, a trader may want to compare the performance of a particular stock with the performance of the overall stock market.
- Calculate the relative strength ratio: The next step is to calculate the ratio by dividing one asset's price by another's price. For example, divide the price of the stock they are analyzing by the price of a market index, such as the S&P 500. The resulting ratio represents the performance of the stock relative to the benchmark.
- Chart the ratio: Traders can chart it over time after calculating it. This allows them to see how the performance of the stock or asset they are analyzing compares to the benchmark over time.
- Analyze the trend: By analyzing the trend of the relative strength ratio, a trader can determine whether the stock or asset is outperforming or underperforming the benchmark. If the ratio is trending upward, it indicates that the stock is outperforming the benchmark, while a downward trend suggests the opposite.
- Use the information to make investment decisions: Finally, the trader can use the information from the analysis to make informed investment decisions. For example, if a stock shows strong relative strength, a day trader may consider buying it as a potential investment opportunity.
How To Calculate?
The relative strength of a security or investment can be calculated using the following formula:
Relative strength = (Price of Security A / Price of Security B) x 100
In this formula, security A is the security a trader analyzes, and security B is the benchmark or reference security they compare it to. For example, a trader may compare the price of a particular stock with the price of a market index, such as the S&P 500.
To calculate the relative strength using this formula, divide the price of security A by the price of security B and then multiply the result by 100. The resulting number represents the relative strength of security A compared to security B.
After calculating it, the trader can plot it on a chart to analyze its trend. By comparing the relative strength of different securities, investors can identify which ones outperform or underperform their benchmarks and make informed investment decisions.
Examples
Let us look at some examples to understand the concept better:
Example #1
Let's say Alice wants to compare the performance of stock ABC with the performance of the S&P 500 index over six months. Here are the closing prices for each at the end of each month:
Month 1: ABC = $50, S&P 500 = $4,000
Month 2: ABC = $55, S&P 500 = $4,100
Month 3: ABC = $57, S&P 500 = $4,200
Month 4: ABC = $60, S&P 500 = $4,300
Month 5: ABC = $58, S&P 500 = $4,400
Month 6: ABC = $62, S&P 500 = $4,500
To calculate the relative strength of ABC compared to the S&P 500, we use the formula:
(Price of ABC / Price of S&P 500) x 100
So for each month, Alice can calculate the relative strength as follows:
Month 1: (50 / 4,000) x 100 = 1.25
Month 2: (55 / 4,100) x 100 = 1.34
Month 3: (57 / 4,200) x 100 = 1.36
Month 4: (60 / 4,300) x 100 = 1.40
Month 5: (58 / 4,400) x 100 = 1.32
Month 6: (62 / 4,500) x 100 = 1.38
Alice can then plot the relative strength of ABC on a chart over the six months to see its trend, and Alice can see that the calculated value of ABC compared to the S&P 500 has generally been increasing over the six months. This indicates that ABC has been outperforming the S&P 500 over this time. An investor can use this information to make informed investment decisions, such as potentially buying ABC as a potential investment opportunity.
Example #2
A great example from during the COVID bear market is B&G Foods (BGS), the name behind Crisco, Cream of Wheat, and Green Giant, among other major food brands. So while the rest of the market (including B&G's consumer staples sector!) was getting hammered, B&G wasn't merely relatively strong—it was outright strong.
B&G Foods (BGS) stood out as a company with strong relative strength, which, combined with its juicy dividend, made it an attractive investment option. However, BGS's debt and market capitalization caught up to it amid rising interest rates and inflationary pressures, leading to a 60% dividend cut in 2022.
Relative Strength vs Relative Strength Index
Technically, both are useful technical indicators for traders and investors to evaluate the performance of securities over a specified time frame. However, while relative strength measures a security's strength relative to its past performance, the relative strength index measures the magnitude and speed of price movements. As a result, it can help identify overbought or oversold conditions.
| Relative Strength (RS) | Relative Strength Index (RSI) |
|---|---|
| Measures the strength of a security relative to its past performance. | Measures the magnitude and speed of price movements of a security over a specified time frame. |
| It is calculated by dividing the price performance of one security by the price performance of another security or benchmark index over a specific period. | It is calculated using a formula that considers the average gains and losses over a specified time frame, usually 14 days. |
| Gives a ratio that reflects the security's outperformance or underperformance compared to its past performance. | Gives a value between 0 and 100 that reflects the security's overbought or oversold condition, with values above 70 indicating overbought and values below 30 indicating oversold. |
| Helps identify securities that are performing well and likely to continue to perform well in the future. | Helps identify securities that may be overbought or oversold and due for a price reversal. |
| It can be used as a standalone indicator or in combination with other indicators to make trading decisions. | It can be used as a standalone indicator or in combination with other indicators to make trading decisions. |
For professional-grade stock and crypto charts, we recommend TradingView – one of the most trusted platforms among traders.
Disclosure: This article contains affiliate links. If you sign up through these links, we may earn a small commission at no extra cost to you.

Frequently Asked Questions (FAQs)
One limitation is that it only looks at price performance and does not consider other factors such as earnings, dividends, or company fundamentals. Additionally, past performance does not guarantee future results, so investors should be cautious in relying solely on this technique for investment decisions.
It can be used to compare securities across different industries or sectors if they have a common benchmark or index to compare against.
The line plots a security's price performance compared to a benchmark over time, often used in technical analysis to identify trends and potential buy/sell signals.
While relative strength and price momentum measure a security's price performance over time, relative strength compares the security's performance to a benchmark or index, while price momentum looks at absolute price changes.
Recommended Articles
This article has been a guide to what is Relative Strength. We compare it with the relative strength index, explain how to calculate it, and its examples. You may also find some useful articles here -
