Table Of Contents
What is the Relative Standard Deviation?
Relative Standard Deviation (RSD) measures the deviation of a set of numbers disseminated around the mean. One may calculate it as the ratio of standard deviation to the mean for a set of numbers. The higher the deviation, the further the numbers are from the mean. The lower the deviation, the closer the numbers are to the mean.
Key Takeaways
- The Relative Standard Deviation (RSD) measures the dispersion of a set of numbers around the mean.
- It is calculated as the ratio of the standard deviation to the mean of the numbers. A higher RSD indicates a greater deviation, meaning the numbers are spread further away from the mean.
- Conversely, a lower RSD indicates a smaller deviation, suggesting the numbers are closer to the mean.
- RSD is useful in determining the dispersion of values relative to the mean and helps assess the precision or consistency of a set of values.
Relative Standard Deviation Formula
Relative Standard Deviation = (Standard Deviation / Mean) * 100

Standard Deviation σ = √
For example, in financial markets, this ratio helps quantify volatility. The RSD formula helps assess the risk involved in security regarding the movement in the market. If this ratio for security is high, then the prices will be scattered, and the price range will be wide. It means the volatility of the security is high. If the ratio for security is low, then the prices will be less scattered. It means the volatility of the security is low.
How to Calculate Relative Standard Deviation? (Step by Step)
Follow the below steps:
- First, calculate the mean (μ), i.e., the average of the numbers
- Once we have the mean, subtract the mean from each number, which gives us the deviation, and squares the deviations.
- Add the squared deviations and divide this value by the total number of values. It is the variance.
- The square root for the variance will give us the standard deviation (σ).
- Divide the standard deviation by the mean and multiply this by 100.
- Hurray! You have just cracked how to calculate the relative standard deviation formula.
To summarize, dividing the standard deviation by the mean and multiplying by 100 gives a relative standard deviation. That’s how simple it is!
Before we move ahead, there’s some information you should know. First, when the data is a population on its own, the above formula is perfect, but if the data is a sample from a population (say, bits and pieces from a bigger set), the calculation will change.
The change in the formula is as below:
Standard Deviation (Sample) σ = √
When the data is a population, it should be divided by N.
When the data is a sample, it should be divided by N-1.
Examples
Example #1
Marks obtained by 3 students in a test are as follows: 98, 64, and 72. But first, calculate the relative standard deviation.
Solution:
Below is given data for calculation

Mean
Calculation of Mean

μ = Σx/ n
where μ is the mean; Σxi is a summation of all the values, and n is the number of items
μ = (98+64+72) / 3
μ= 78
Standard Deviation
Therefore, the calculation of Standard Deviation is as follows,

Adding the values of all (x- μ)2 we get 632
Therefore, Σ(x- μ)2 = 632
Calculation of Standard Deviation:
σ = √
=√632/3
σ = 14.51
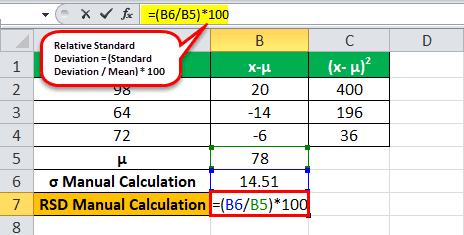
RSD

Formula = (Standard Deviation / Mean) * 100
= (14.51/78)*100
Standard Deviation will be -

RSD = 78 +/- 18.60%
Example #2
The following table shows prices for stock XYZ. Find the RSD for the 10 day period.
Solution:
Below is given data for calculation of relative standard deviation.

Mean
Calculation of Mean

μ = (53.73+ 54.08+ 54.14+ 53.88+ 53.87+ 53.85+ 54.16+ 54.5+ 54.4+ 54.3) / 10
μ = 54.091
Standard Deviation
Therefore, the calculation of Standard Deviation is as follows,

Calculation of Standard Deviation:
σ = 0.244027
RSD

Formula = (Standard Deviation / Mean) * 100
= (0.244027/54.091)*100
Standard Deviation will be -

RSD = 0.451141
Formula Example #3
An organization conducted a health checkup for its employees and found that majority of the employees were overweight, the weights (in kgs) for 8 employees are given below, and you are required to calculate the Relative Standard Deviation.
Solution:
Below is given data for calculation of relative standard deviation.

Mean
Calculation of Mean

μ = (130 + 120 + 140 + 90 + 100 + 160 + 150 + 110) / 8
μ = 125
Standard Deviation
Therefore, the calculation of Standard Deviation is as follows,

Calculation of Standard Deviation:
σ = 24.4949
RSD

Formula = (Standard Deviation / Mean) * 100
= (24.49490/125)*100
Standard Deviation will be -

RSD = 19.6
Since the data is a sample from a population, the RSD formula needs to be used.
Relevance and Use
The relative standard deviation helps measure the dispersion of a set of values related to the mean. It allows us to analyze the precision of a set of values. The value of RSD expresses in percentage. It helps to understand whether the standard deviation is small or huge compared to the mean for a set of values.
The denominator for calculating RSD is the absolute value of the mean, and it can never be negative. Hence, RSD is always positive. The standard deviation analyzes in the context of the mean with the help of RSD. RSD is used to analyze the volatility of securities. In addition, RSD enables the comparison of the deviation in quality controls for laboratory tests.

