Table Of Contents
Regression Line Definition
A regression line indicates a linear relationship between the dependent variables on the y-axis and the independent variables on the x-axis. The correlation is established by analyzing the data pattern formed by the variables.
The regression line is plotted closest to the data points in a regression graph. This statistical tool helps analyze the behavior of a dependent variable y when there is a change in the independent variable x—by substituting different values of x in the regression equation.
Key Takeaways
- The regression line establishes a linear relationship between two sets of variables. The change in one variable is dependent on the changes to the other (independent variable).
- The Least Squares Regression Line (LSRL) is plotted nearest to the data points (x, y) on a regression graph.
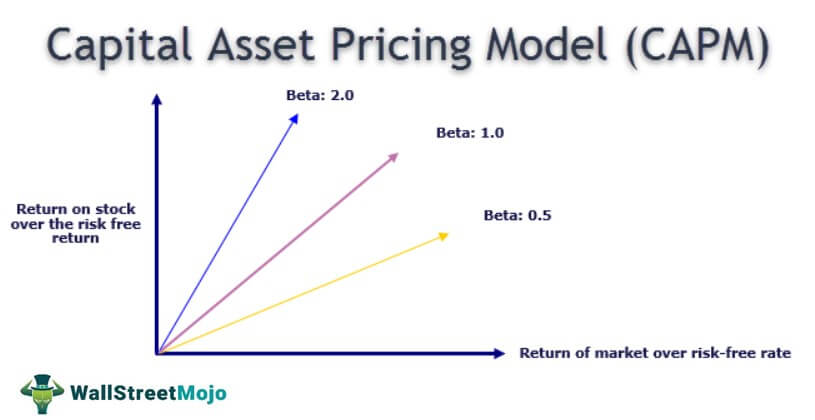
- Regression is widely used in financial models like CAPM and investing measures like Beta to determine the feasibility of a project. It is also used for creating projections of investments and financial returns.
- If Y is the dependent variable and X is the independent variable, the Y on X regression line equation is represented as follows: 'Y = a + bX + ɛ.'
Regression Line Explained
A regression line is a statistical tool that depicts the correlation between two variables. Specifically, it is used when variation in one (dependent variable) depends on the change in the value of the other (independent variable).
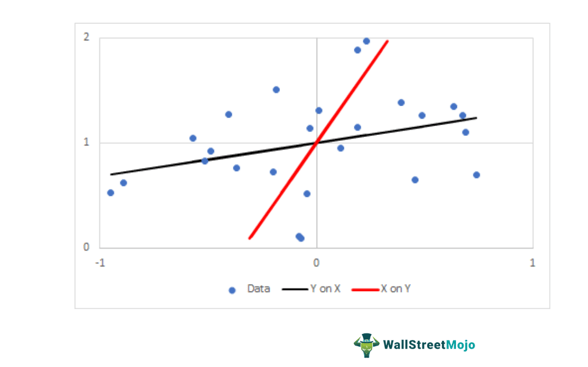
There can be two cases of simple linear regression:
- The equation is Y on X, where the value of Y changes with a variation in the value of X.
- The equation is X on Y, where the change in X variable depends upon the Y variable's deviation.
Regression is extensively applied to various real-world scenarios—business, investment, finance, and marketing. For example, in finance, regression is majorly employed in the Beta and Capital Asset Pricing Model (CAPM—for estimating returns and budgeting.
Using regression, the company can determine the appropriate asset price with respect to the cost of capital. In the stock market, it is used for determining the impact of stock price changes on the price of underlying commodities.
In marketing, regression analysis can be used to determine how price fluctuation results in the increase or decrease in goods sales. It is very effective in creating sales projections for a future period—by correlating market conditions, weather predictions, economic conditions, and past sales.
Formula
The formula to determine the Least Squares Regression Line (LSRL) of Y on X is as follows:
Y=a + bX + ɛ
Here,
- Y is the dependent variable.
- a is the Y-intercept.
- b is the slope of the regression line.
- X is the independent variable.
- ɛ is the residual (error).
Also,
b = (N∑XY-(∑X)(∑Y) / (N∑X2- (∑X)2) ;
And,
a = (∑Y - b ∑X) / N
Where N is the total number of observations.
Example
Let us look at a hypothetical example to understand real-world applications of the theory.
The finance manager of ABC Motors wants to correlate variation in sales and variation in the price of electric bikes. For this purpose, he analyzes data pertaining to the last five years.
We assume there is no error. The price and sales volume for the previous five years are as follows:
| Year | Price (in $) | Sales Volume |
| 2017 | 2100 | 15000 |
| 2018 | 2050 | 16500 |
| 2019 | 2000 | 21000 |
| 2020 | 2200 | 19000 |
| 2021 | 2050 | 20000 |
Based on the given data, determine the regression line of Y on X,
Solution:
Let us determine the regression line of Y on X:
Given:
- Y = Sales Volume
- X = Profit
- N = 5
- ɛ = 0
| Year | Price (in $) (X) | Sales Volume (Y) | X2 | XY |
| 2017 | 2100 | 15000 | 4410000 | 31500000 |
| 2018 | 2050 | 16500 | 4202500 | 33825000 |
| 2019 | 2000 | 21000 | 4000000 | 42000000 |
| 2020 | 2200 | 19000 | 4840000 | 41800000 |
| 2021 | 2050 | 20000 | 4202500 | 41000000 |
| - | 10400 | 91500 | 21655000 | 190125000 |
Y = a + bX + ɛ
Let us first find out the value of b and a:
b = (N∑XY-(∑X)(∑Y) / (N∑X2- (∑X)2)
- b = ((5×190125000) - (10400×91500)) / ( (5×21655000) - 104002 )
- b = (950625000-951600000) / (08275000 -108160000)
- b = - 8.478
a = (∑Y - b ∑X) / N
- a = 91500 - ( - 8.478 × 10400) / 5
- a = 35935
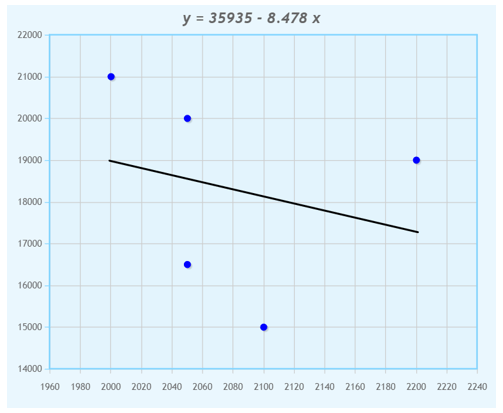
- Y = 35935 + ( - 8.478 X) + 0
- Y = 35935 – 8.478X
The data is represented as a regression line graph:
(Source)
Visualization of collected data makes data interpretation easier. The regression line is sometimes called the line of best fit.
It is important to note that real-world data cannot always be expressed with a regression equation. If the majority of observations follow a pattern, then the outliers can be eliminated. But sometimes, there is no obvious pattern. If there are random irregularities in collected data—the regression method is not suitable.
