Table Of Contents
Key Takeaways
- Regression analysis explores the relationship between dependent and independent variables, showing how the dependent variable changes when one or more independent variables are altered due to various factors.
- The regression analysis formula aims to find the best-fit line that represents the relationship between the dependent and independent variables.
- The regression analysis formula aims to find the best-fit line that represents the relationship between the dependent and independent variables.
- By examining the regression between dependent and independent variables, one can assess the potential impact of specific actions on profitability or other outcomes, making it a crucial tool in finance and other fields.
Explanation
While running a regression, the main purpose of the researcher is to find out the relationship between the dependent and independent variables. Then, one or multiple independent variables chose to help predict the dependent variable. Regression analysis helps in the process of validating whether the predictor variables are good enough to help in predicting the dependent variable.
Examples
Example #1
Let us try and understand the concept of regression analysis with the help of an example. First, let us try to find out the relation between the distance covered by the truck driver and the age of the truck driver. Then, someone does a regression equation to validate whether what he thinks of the relationship between two variables is also validated by the regression equation.
Below is given data for calculation

For the calculation of regression analysis, go to the "Data" tab in Excel and then select the "Data Analysis" option. For further calculation procedure, refer to the given article here - Analysis ToolPak in Excel

The regression analysis formula for the above example will be
- y = MX + b
- y= 575.754*-3.121+0
- y= -1797
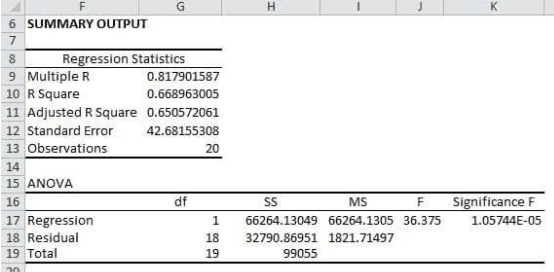
In this particular example, we will see which variable is the dependent variable and which variable is the independent variable. The dependent variable in this regression equation is the distance covered by the truck driver, and the independent variable is the age of the truck driver. The regression for this set of dependent and independent variables proves that the independent variable is a good predictor of the dependent variable with a reasonably high coefficient of determination. In addition, the analysis helps validate that the factors in the form of the independent variable are selected correctly. The snapshot below depicts the regression output for the variables. The data set and the variables are present in the Excel sheet attached.
Example #2
Let us try and understand regression analysis with the help of another example. Let us try to find out the relation between the height of the students of a class and the GPA grade of those students. Then, someone does a regression equation to validate whether what he thinks of the relationship between two variables is also validated by the regression equation.
In this example, Below is given data for calculation in excel

For regression analysis calculation, go to the "Data" tab in Excel and select the "Data Analysis" option.

The regression for the above example will be
- y = MX + b
- y= 2.65*.0034+0
- y= 0.009198
In this particular example, we will see which variable is the dependent variable and which variable is the independent variable. The dependent variable in this regression equation is the student's GPA, and the independent variable is the student's height. The regression analysis for this set of dependent and independent variables proves that the independent variable is not a good predictor of the dependent variable as the value for the coefficient of determination is negligible. In this case, we need to find another predictor variable to predict the dependent variable for the regression analysis. The snapshot below depicts the regression output for the variables. The data set and the variables are present in the Excel sheet attached.
Relevance and Uses
Regression is a very useful statistical method. One can validate any business decision to validate a hypothesis that a particular action will increase a division's profitability based on the regression between the dependent and independent variables. Therefore, the regression analysis equation plays a very important role in finance. In addition, a lot of forecasting is performed using regression. For example, one can predict the sales of a particular segment in advance with the help of macroeconomic indicators that have a very good correlation with that segment. Both linear and multiple regressions are useful for practitioners to make predictions of the dependent variables and validate the independent variables as a predictor of the dependent variables.

