Table of Contents
Range-Bound Market Meaning
A range-bound market refers to a market where a financial instrument, for example, a stock, trades within a specific price range. Traders can take advantage of this scenario and make predictable financial gains by identifying support and resistance levels and executing buy and sell orders accordingly.
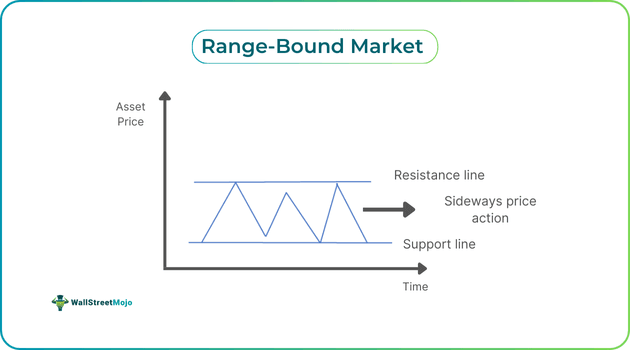
In this market, both buyers and sellers fail to gain complete control. As a result, the formation of a new low or high does not take place, and the security’s price remains within the resistance and support levels. Individuals can utilize range-bound market indicators, like Bollinger bands and relative strength index (RSI), to identify sideways price action.
Key Takeaways
- Meaning of range bound market refers to a market in which an asset’s price keeps fluctuating between the support and resistance levels. Individuals can utilize specific strategies to earn financial gains in such markets.
- A widely used strategy for range-bound markets is the bounce strategy. Traders need to enter positions near support or resistance levels and exit when the price bounces and reaches the upper or lower trading range.
- Some popular indicators that one can utilize to spot choppy markets are ADX, RSI, and Bollinger bands.
- Typically, sideways price action materializes following a noteworthy price movement in the market.
Range Bound Market Explained
Meaning of range bound market refers to a market in which the price of a security trades between the support level and the resistance level. Individuals can trade using different strategies involving the use of indicators in such markets to make profits.
A number of factors may contribute to a sideways market. For example, if there’s a lack of economic data or news concerning a financial instrument, it may lead to an absence of a clear market direction. Hence, the price may move within a tight range. Other factors can be the time of the day or seasonality. For instance, during a particular time of the day, the trading volume might be very low, resulting in insignificant price movements.
Generally, one can spot sideways price action that occurs following a significant price move as buyers and sellers fight to exert dominance in the market. When the bulls or bears gain control, the financial instrument’s price breaks through the resistance level or support levels, leading to the formation of a new trend.
Many traders use Saxo Bank International to research and invest in stocks across different markets. Its features like SAXO Stocks offer access to a wide range of global equities for investors.
How To Identify?
As noted above, one can utilize different range-bound market indicators to identify choppy markets. Let us look at them in detail.
- Bollinger Bands: This indicator consists of three lines. While the lower and upper lines depict volatility, the middle band indicates the price direction. In choppy markets, the price of a security moves within the lower and upper bands, and the gap between the two lines is narrow. Note that the lesser the gap, the lower the volatility.
- RSI: The RSI is a technical analysis tool measuring the rate and speed at which a financial instrument’s price increases or decreases in the market. Usually, its computation takes place over a period of 14 days, and its value ranges from 0 to 100. A value of below 30 indicates oversold conditions. On the other hand, a value of above 70 indicates overbought conditions. In the case of a choppy market, the value is between 30 and 70.
- Average Directional Index: Also known as ADI, in short, this indicator indicates a trend’s strength. Its value ranges from 0-100, with 0 indicating no strength while 100 suggesting maximum trend strength. A value of less than 25 generally depicts a range-bound or indecisive market.
Let us look at this TradingView chart to find out how one can utilize any one of the above indicators to spot ranging markets.
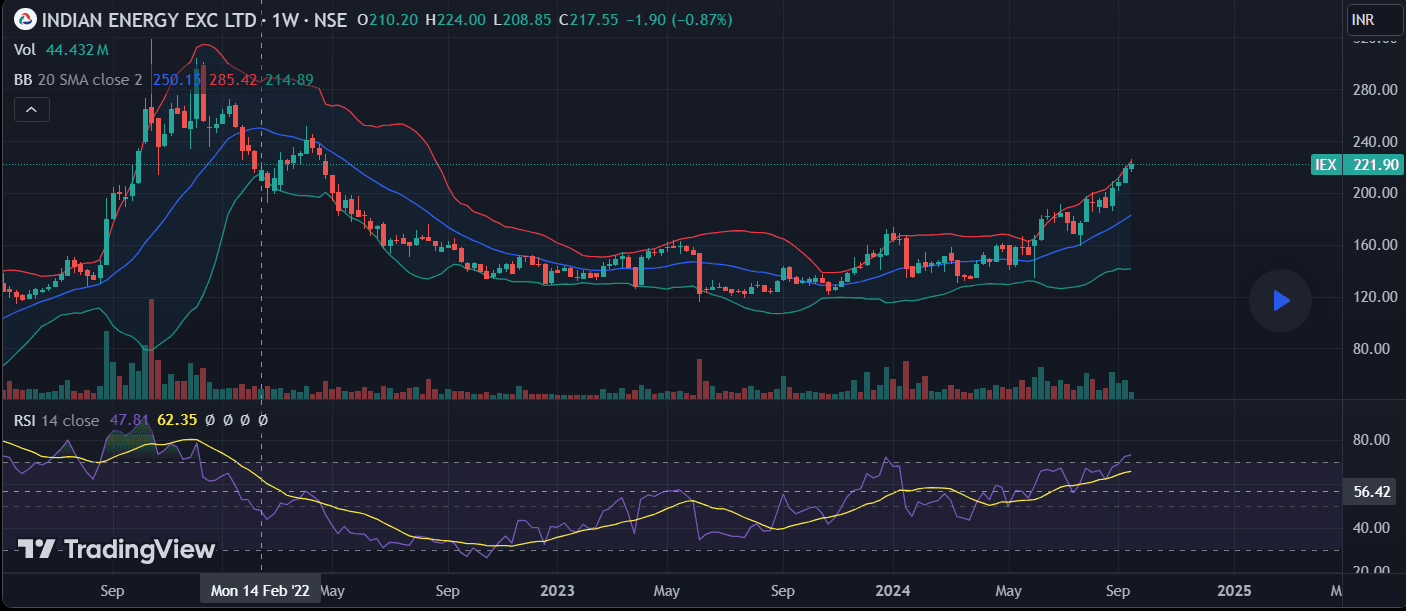
In the above weekly Indian Energy Exchange chart, we can see that after a strong downtrend, a range-bound market materialized as the price fluctuated within a specific range. If individuals consider the period starting from September 12, 2022, and ending on May 29, 2023, they can clearly observe that the price was trading within a tight range. The RSI values and the narrow gap between the upper and lower lines of the Bollinger bands indicator in the above chart also indicate a range-bound market.
How To Trade?
A popular strategy for range-bound markets is a bounce strategy, which involves traders entering and exiting their positions near the resistance and support and resistance levels. This move enables them to make financial gains when the price of a financial instrument bounces back near the upper or lower range.
Another popular strategy is the breakout trading strategy, which involves traders entering long or short positions when a breakout near the resistance or support level occurs. Thus, this strategy enables one to make a profit from the forthcoming trend.
Individuals must remember to utilize take-profit orders as well as stop-loss orders to secure their financial gains and limit losses that may result from unexpected price movements.
Examples
Let us look at a few range-bound market examples to understand the concept better.
Example #1
Suppose Garry is an equity trader who had Stock DFG on his watchlist for a week. Following a strong downtrend, the stock is trading within a tight range. Noticing the sideways price action, Gary uses two indicators, RSI and Bollinger bands, to confirm if it is a range-bound market. The RSI values ranged between 30 and 40, indicating an indecisive market. Moreover, the gap upper and lower bands was extremely narrow, indicating a choppy market.
So, using the bounce strategy, he placed a buy order when the price reached near the support level. When the price reaches close to the resistance line, he sells the shares, thus making financial gains from the choppy market.
Example #2
According to a report published on August 19, 2024, Bitcoin continued to trade sideways as the bulls were successful in defending the support level of $55,724 that week. Institutional investors, for example, Capula Management and Goldman Sachs, utilized the range-bound market to purchase spot Bitcoin ETFs.
According to Matthew Hyland, a crypto analyst, Bitcoin was following patterns that were similar to the ones that materialized in prior US election years. That’s why he believed that the choppy market scenario may remain a bit longer and a breakout might occur in the month of October or November.
Disclosure: This article contains affiliate links. If you sign up through these links, we may earn a small commission at no extra cost to you.