Table Of Contents
What Is R Programming Language?
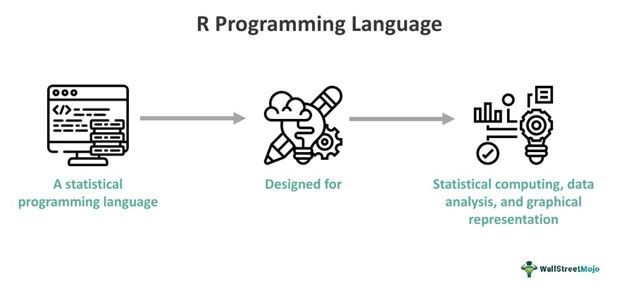
R is a programming language that is open-source software widely used for statistical computing and data analysis. This programming language aims to provide a comprehensive set of tools for data manipulation, statistical modelling, and graphical representation.
Hence, R works using objects, defined by their contents and names and attributes that describe the types of data they can represent. In addition, the language provides a wide range of essential statistical analytical functions, including least squares regression, analysis of variance, time series analysis, and other classical tests. They also provide a comprehensive set of tools for data manipulation, statistical modeling, and graphical representation.
Key Takeaways
- R is a programming language and open-source software widely used for statistical computing and data analysis.
- Ross Ihaka and Robert Gentleman developed R at the University of Auckland, New Zealand. The first appearance of R was in 1993
- This enables users to create loops that analyze various data sets sequentially. Additionally, it is feasible to combine various statistical functions into a single program to carry out more intricate studies.
- It is open-source, which means that its source code is freely available, and users can modify and distribute it.
R Programming Language Explained
The R programming language refers to a system for both statistical analysis and graphics. The R language is regarded as the S language's dialect and software. R is accessible in several formats, and the syntax is intuitive and straightforward. Moreover, it plays a crucial role in a wide range of data analysis and research projects because it makes many simple and advanced modern statistical methods readily available and simple to use.
Furthermore, this programming language performs all operations on objects stored in the computer's active memory and does not use temporary files. The input and output of data and the results, such as graphics, use the reading and writing of files. With a few commands, the user can carry out the functions. Here, the program immediately displays outcomes on the screen, saves them in objects, or writes them to the disk, particularly for graphics. Because the outcomes are tangible objects, users can treat them as data and study them accordingly. As a result, one can read data files from either the local disk or a remote server accessible via the internet.
The R programming language easily integrates with other programming languages such as C, C++, and Python. It also supports data interchange formats like CSV, Excel, and databases. However, the supported file types may vary depending on the operating system. It also enables writing intermediate results, such as regression, residuals, and coefficients, into a file for subsequent analysis. In addition, the programming language also enables users to create loops that analyze various data sets sequentially.
Additionally, it is feasible to combine various statistical functions into a single program to carry out more intricate studies. Thus, the developers release the R programming language under the terms of the widely used open-source license, the GNU General Public License (GPL).
History
The S programming language, created at Bell Laboratories in the early 1970s by John Chambers and others, is the ancestor of the R programming language. In the Department of Statistics at the University of Auckland in Auckland, New Zealand, Ross Ihaka and Robert Gentleman created R. Hence, the first appearance of R was in 1993. A 1996 publication in the Journal of Computational and Graphical Statistics documented Ross and Robert's experience in creating R.
Soon after, in 1997, a core group was formed to oversee the language's development. The R Development Core Team is a group of statisticians who work under the GNU (General Public License) terms to create and distribute the R language. Here, the R core team has access to check changes in the main R source tree and has control over the R source code.
Examples
Check out these examples for a better idea:
Example #1
As per the recent report, R is currently the preferred programming language used by some of the largest companies in the sector, including Google, Facebook, Novartis, Deloitte, Amazon, Accenture, Bank of America, and The New York Times.
Since every industry today depends on data, R has gained a significant following over time, not only in the data science and IT communities but also in the business sector. It includes programs for many business-related topics, including econometrics and finance.
Furthermore, people in the IT and data communities are familiar with R's features, such as time series, statistical inference, classification, clustering, linear and non-linear modeling, and machine learning techniques, among many others. Therefore, this is partially due to R's dual benefits as a programming language and a graphical and statistical computing environment.
R also excels at reporting, visualization, and interactivity, which are critical to the data science and business domains. The increasing use of R by respectable companies and its increasing popularity are driving career opportunities in the language.
Example #2
In a hypothetical finance scenario, Jason leveraged the capabilities of the R programming language to conduct a risk analysis for a diversified investment portfolio. After importing historical stock and bond data, Jason utilized R's time series analysis functions to model the assets' behavior and estimate potential future returns. Moreover, the quantmod package facilitated the retrieval of real-time market data, aiding in the assessment of current portfolio value and volatility. Using statistical techniques available in R, he simulated various market scenarios to stress-test the portfolio's performance under different economic conditions.
Hence, the performance analytics package enabled the calculation of key performance metrics, assisting in the evaluation of risk-adjusted returns. R's versatility allowed me to create interactive and visually compelling dashboards using packages like Shiny for effective communication of the analysis results to stakeholders. Hence, this hypothetical finance project showcased R's strength in quantitative analysis, risk management, and data visualization within the context of investment strategy.
Uses
Some of the uses of the language are given below:
- R offers several operators for calculating lists, vectors, arrays, and matrices.
- Moreover, it offers a large, well-organized, and comprehensive collection of tools for statistical data analysis.
- Hence, it offers graphical tools for data analysis, research and display that can be used on a computer or printed on paper.
- It is good at vectorization. Writing functions applied pointwise to each vector element is relatively simple in R. This is helpful for statistics.
- It is a valuable programming tool for importing and cleaning data; hence, it is helpful for quantitative analysts.
- It is also commonly used for analyzing time series data, making it valuable in fields such as finance, economics, and environmental science.
- Researchers in social sciences use R for statistical analysis, survey data, and social network analysis.
Advantages And Disadvantages
Check out the main advantages and disadvantages of R:
Advantages
- This programming language has a variety of functions and hence proves an excellent tool for statisticians. The function of a graphical display adds to the ease of research.
- R programming language functions have a liberal syntax and are easy to code even if the command does not exist.
- It can be easily integrated with other programming languages like C, C++, and Python, allowing users to leverage functionality from different environments.
- R programming language extensions are created by the R community and cover a wide range of domains, allowing users to access specialized tools and methods for various tasks.
Disadvantages
- It would be familiar for relatively advanced users and could be difficult to understand for those unfamiliar with the subject.
- Better options are available to use analytical methods, such as algebraically integrating functions and numerical methods (solving partial differential equations).
- While R provides powerful graphics capabilities, creating highly interactive or real-time graphics might be more challenging compared to specialized tools.
R Programming Language vs Python vs SAS (Statistical Analysis System)
Here are the differences between the three:
| Key points | R programming language | Python | SAS |
|---|---|---|---|
| Concept | Language of R for Programming is a free and open-source language that anyone can use to perform data analysis tasks. Data miners frequently use the R language For creating statistical software and conducting data analysis. | Python is a programming language. It can be utilized for banking research because it is made to execute statistical analysis and produce images.it is an additional programming language that anyone can access for free. Compared to R or SAS, its code is simpler to learn. | The SAS Programming Language is a programming language that uses spreadsheets as its primary input method to produce output. The output is based on statistical analysis findings as tables and graphs in PDF, RTF, and HTML documents. |
| Year of introduction | The program appeared publically for the first time in 1993. | Guido van Rossum developed Python, originally made available on February 20, 1991 | It is open-source, compatible with all operating systems, and considers many of the evolving industry standards. Additionally, it is very standardized. |
| Accessibility | It is an open-source, compatible with all operating systems, and considers many of the evolving industry standards. Additionally, it is very standardized. | This language is also open source and can be accessed by anyone, anywhere. | It is a paid software system that provides high-performance analytics for banking research. |
