What Is Quantitative Data?
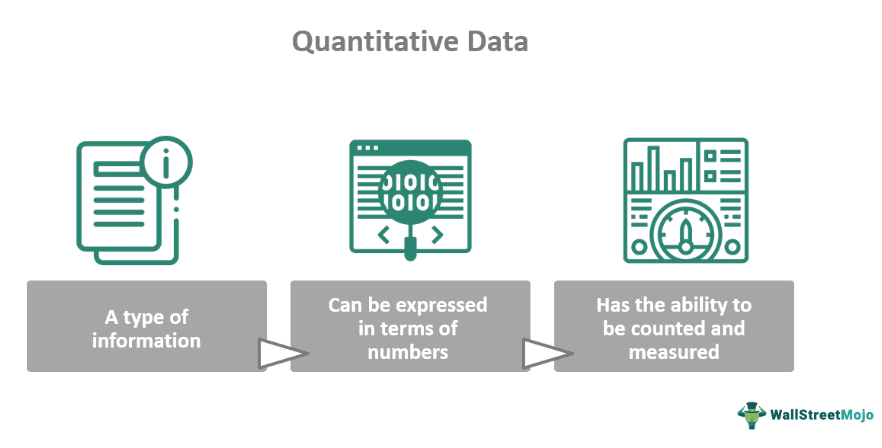
Quantitative data is the numerical information that can be expressed in quantities or amounts. It possesses the ability to be counted and measured. Thus, this data provides a precise and objective way to describe and analyze events, which makes it suitable for scientific research and data analysis.

This data can be subjected to mathematical operations. For instance, this data may include length, weight, temperature, and time measurements. It may also include numerical counts like the number of people in a population, the sales revenue of a company, or the scores obtained by individuals on a specific test.
Key Takeaways
- It can be quantified, counted, and measured. So, the data allows for a precise and objective way to record, report, and analyze occurrences, supporting research and data analysis.
- Moreover, these numeric values benefit several research domains, commerce, and decision-making processes as they provide a basis for statistical analysis.
- However, some characteristics are too complex to be expressed in quantitative terms. Moreover, these values may not effectively capture the entire complexity of certain features.
Quantitative Data Explained
Quantitative data is a fundamental aspect of research and analysis and encompasses information that can be expressed in numerical terms. As a result, it allows for precise measurement, quantification, and mathematical calculation. This data type is crucial in various scientific disciplines, business, and decision-making processes. Researchers collect and analyze numerical data to answer questions, test hypotheses, and conclude various occurrences.
The numeric values provide a basis for statistical analysis, enabling scientists to identify patterns, relationships, and trends. Thus, this data is instrumental for strategic planning, performance evaluation, and market analysis. Financial data, including revenue, profit margins , and expenses, are essential quantitative measures that help assess a company’s financial health.
Additionally, market research employs numerical data to determine consumer preferences, market share, and pricing strategies. Furthermore, this quantitative approach aids businesses in making data-driven decisions that enhance their competitiveness and profitability.
Characteristics
Some characteristics of quantitative data include:
- The data consists of numerical values that can be counted or measured. These values are expressed as numbers, which are suitable for mathematical operations.
- This data is objective and not subject to personal interpretation or bias. It relies on standardized measurement tools and methods. Thus, it reduces the influence of individual perceptions or opinions.
- It is associated with specific units of measurement. Hence, these units provide context and precision to the data.
- The data allows for quantification. This characteristic of quantitative data means that the data can be expressed in amounts or quantities. Furthermore, this property facilitates the comparison of different data points and enables calculation.
Types
The types of quantitative data are:
- Continuous Data: It is one of the types of quantitative data that is measured on a continuous scale and can take an infinite number of values within a given range. It includes measurements like height, weight, temperature, and time. The data is also usually analyzed using mean, standard deviation, and correlation techniques.
- Discrete Data: Discrete data consists of distinct, separate values. It can be counted, and there are gaps or intervals between possible values. This data is often analyzed using frequency distributions and bar charts.
- Interval Data: Interval data is numeric data with consistent intervals between values but lacks a zero point. It can be analyzed using mean and standard deviation.
- Ratio Data: This is numeric data with consistent intervals between values and a valid zero point. As a result, it allows for meaningful ratios and calculations like percentages. Additionally, it can be analyzed using all statistical techniques, including mean, median, mode, standard deviation, and correlation.
Collection & Analysis
Some standard data collection techniques are:
- Surveys and Questionnaires: Surveys and questionnaires are widely used data collection tools. Researchers design a set of structured questions with predefined response options and distribute them to a sample of participants. Moreover, surveys can be administered in various formats, including face-to-face interviews, phone interviews, paper forms, or online forms and surveys.
- Observations: Observational techniques involve systematically watching and recording behaviors, events, or phenomena. Researchers use predefined criteria and observational rules to gather the data. Additionally, observations can be conducted in natural settings or controlled environments. They provide valuable data for analyzing patterns and trends.
A method of this data is:
- Descriptive Statistics: Descriptive statistics methods are used to summarize and describe the main features in a dataset. This technique includes measures of central tendency , including the mean, median, and mode. Furthermore, they provide insights into the data set‘s values. Measures of dispersion, like the range, standard deviation, and variance, help assess the spread or variability of the data.
Examples
Let us study the following examples to understand this data:
Example #1
Suppose John is a business owner who wants to analyze his retail store’s monthly sales data to make informed decisions. He collected the quantitative data by recording the total sales revenue for each month over the past year. After organizing the data, John used the analysis techniques. He used the mean monthly revenue method to calculate the average monthly sales of $10,000.
Moreover, John created a line chart that revealed that the sales peaked during the holiday season in December. Since the results indicated that holiday season sales were higher, John decided to plan for increased inventory and marketing efforts during that time.
Example #2
The Quantitative Perspectives Report released by PitchBook in 2022 describes how market uncertainties might affect the private equity landscape in 2023. The US private equity market has had an inconsistent year in 2022. While investors struggled with the slowdown in economic growth, the Federal Reserve abruptly hiked the interest rates.
Furthermore, the likelihood of increased interest rates, tightening economic conditions, a further economic slowdown, and the possibility of a recession looms. The quantitative recession model in the research also predicts a 65% chance that the US economy will enter a recession in late 2023 or early 2024. This is another example of quantitative data.
Advantages And Disadvantages
The advantages of quantitative data are:
- This data is inherently objective and less prone to bias or subjectivity. It relies on standardized measurement techniques and numerical values, allowing different researchers to obtain similar results when measuring the same variables. This objectivity enhances the credibility and reliability of research findings.
- The data is well-suited for statistical analysis. Thus, it enables researchers to apply various statistical techniques to identify patterns, relationships, and trends within the data.
- One of the significant advantages of quantitative data is it aims for precision and accuracy in measurement. As a result, researchers can quantify and compare the data details, making it suitable for applications where precise measurements are essential.
The disadvantages are:
- This data often lacks the depth provided by qualitative data as it may not capture the full complexity of human experiences, emotions, or social interactions. So, researchers may miss valuable insights by relying solely on numbers.
- The data may not address specific research questions effectively, especially those related to perceptions and cultural factors. Some aspects of human behavior and social dynamics are challenging to measure quantitatively. Thus, this limits the scope of inquiry in specific fields.
Quantitative Data vs Qualitative Data
Quantitative Data
- This data is expressed in numerical form and can be measured and quantified. It deals with quantities and objective observations.
- It is collected using standardized measurement tools and instruments. It involves counting or measuring attributes and variables, often with well-defined units.
- The data is usually collected from larger samples and is well-suited for generalizing about populations. Statistical significance tests help determine the reliability of these generalizations.
- It aims for objectivity and minimizes subjectivity or bias in measurements.
Qualitative Data
- Qualitative data consists of descriptive non-numeric information that deals with qualities, attributes, or characteristics. It often involves subjective observations and interpretations.
- The data is collected through interviews, observations, and open-ended surveys. Researchers gather textual or visual information that may not have standardized units of measurement.
- This data analysis identifies the data’s themes, patterns, and meanings. Researchers use coding analysis to uncover the underlying concepts.
- Its collection and analysis may involve subjectivity, relying on researchers’ interpretations and judgments. Researchers’ backgrounds, perspectives, and biases may influence the findings.
Frequently Asked Questions (FAQs)
Why are quantitative data prone to manipulation?
This data may be prone to manipulation because it involves numerical values and statistical analysis, providing distortion opportunities. Data manipulation may occur during data collection, where individuals may intentionally or mistakenly misreport information. Moreover, it may occur during analysis, where researchers selectively present or interpret data to support a specific agenda or viewpoint.
What is discrete quantitative data?
Discrete data is a numerical information type representing distinct, separate values with apparent gaps or intervals between them. It consists of finite, countable values and arises from counting items or events. These values are whole numbers or integers. Moreover, they do not have meaningful fractions or decimals between them.
Can quantitative data be ordinal?
Ordinal data is a definite data type where values have a natural order or ranking. However, the intervals between values are not equal or precisely quantifiable. Although ordinal data is presented numerically, these numbers do not indicate consistent or equal differences between categories. These data have an ordered structure but do not possess equal intervals. Thus, this attribute makes them distinct from quantitative data with consistent intervals.
Recommended Articles
This article has been a guide to what is Quantitative Data. We explain its characteristics, comparison with qualitative data, collection, analysis, examples, & types. You may also find some useful articles here –