Table Of Contents
Summarize Function in Power BI
The summary table is what end users would like to see from a large amount of data. With MS Excel users, we can use PivotTables to drag and drop the table fields to get the summary table. With Power BI, we can use visuals to get the summary table or visual, but one thing you need to learn in Power BI is DAX formulas. One such formula is the SUMMARIZE DAX function. This article will take you through this SUMMARIZE DAX function in detail with practical examples.
What Does SUMMARIZE Function Do in Power BI?
As the word itself says, SUMMARIZE will summarize the huge number of data rows into one table with a provided criteria column. For example, you may have multiple city sales values. Still, each city has multiple rows of transactions, so using the SUMMARIZE function, we can create a summary table where each city will have only one-row transactions with the summarized line.
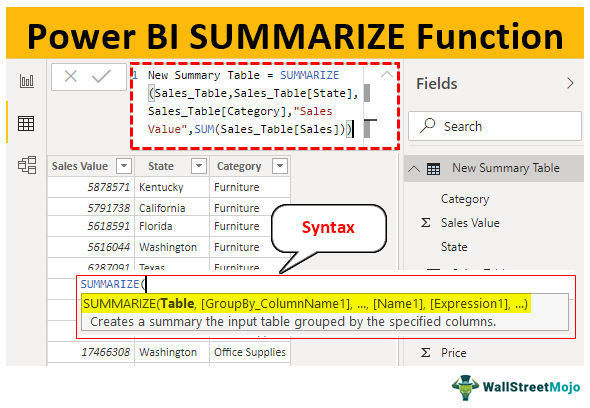
Below is the syntax of the SUMMARIZE function in Power BI.

- Table Name: First we need to mention the table name that we are summarizing.
- Group by Column Name1: From the Table, we need to mention what is the column we are summarizing.
- Group by Column Name2: From the Table, we need to mention what is the second column we are summarizing.
- Name 1: What is the name for the summarizing column?
- Expression 1: What is the kind of summarization you want to do?? Whether you want to sum, whether you want to take the average of the column or some other kind of calculation.
- Name 2: What is the name for the second summarizing column?
- Expression 2: What is the kind of summarization you want to do for the second column??
These are parameters of the power BI SUMMARIZE function.

Examples of SUMMARIZE Function in Power BI
Below are examples of the SUMMARIZE function in Power BI. You can download the workbook using the same file we used in this example.
Example #1
Below are examples of the SUMMARIZE function in Power BI.
- To demonstrate the SUMMARIZE DAX function, we will use the data table. You can download the Excel workbook to follow along with us.

- Upload the data table to the Power BI desktop file.

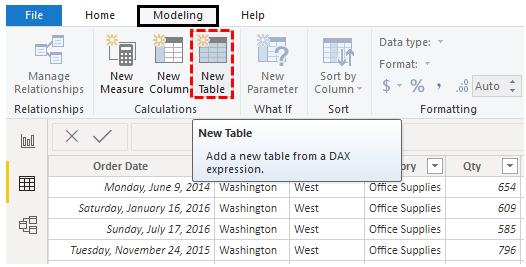
Everybody must remember that the "SUMMARIZE" function groups the data in a new table. Therefore, we can apply the SUMMARIZE function only when we create a new table, so it cannot be used as a "NEW COLUMN" or "NEW MEASURE." - From the above data, we need to summarize the data based on "State," so go to the "Modeling" tab and choose the option of "New Table."

- It will ask you to name the table first, so name it "State Summary Table."

- Now, open the Power BI SUMMARIZE function.

- First, we need to mention the "Table" we are trying to summarize. So, in this case, the table we are summarizing is "Sales_Table," which is the same as the table name.

- We are trying to summarize this table based on the "State" column, so this will be our "GroupBy_ColumnName1."

- Once the column name is specified to summarize, we need to give a name to the new column, "Sales Value."

- "Expression 1" is nothing but how we need to summarize the mentioned column since we add sales values by state name. Open SUM function to add sales column values by each state.

- The column name we need to SUM is the "Sales" column, so mention the same.

- That is it. Close the brackets and press the "Enter" key to get the summarized table based on state names.

As you can see, we have a new table together here. Thanks to the SUMMARIZE function.
Example #2
Imagine summarizing the data based on the "State" and the "Category" columns. So, this is where we need to use multiple conditions of SUMMARIZE function.
- First, mention the SUMMARIZE function in the new table and choose the column to be summarized and the first group by column as "State."

- As of now, we have mentioned the "GroupBy_Column Name1" column. Now, mention the second-level group column name, i.e., the "Category" column.

- Now, we have mentioned the two-level group by columns. Now, give a name for the new column as "Sales Value."

- Expression1 will add all the sales values, so use the SUM function to summarize the "Sale Value" column.

- We are done. Close the bracket and press the "Enter" to get the new summarized table.

Here, we have the new SUMMARIZED table, which we have summarized based on "State" and "Category."
Note: We can also download Power BI SUMMARIZED function file from the link below and view the final output.
Things to Remember Here
- We can only use the Power BI SUMMARIZE function to create a new table.
- If there is only one level summarization, we can move to the "Name1" argument after mentioning the GroupBy column directly.
- We can use all the aggregate functions in the Expression argument to decide the kind of summarization.

