
Table Of Contents
What Does RELATED Function Do in Power BI?
The RELATED, as the name says, will return the corresponding value from one table to another. It is similar to the lookup value function in MS Excel, VLOOKUP.
However, before we apply this DAX function in Power BI, we need to create a data model relationship between the tables we refer to.
Below is the syntax of the RELATED DAX function in Power BI.
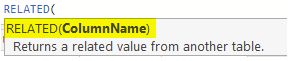
We need to select the result column from the other table. It will fetch the details for us. If you are finding it difficult to understand this theoretical explanation, do not worry; below, we will give you practical examples in detail.
Example of RELATED Function in Power BI
To demonstrate the RELATED DAX function in Power BI, we have prepared below two data tables in an Excel worksheet.
Below are examples of the RELATED function in Power BI. You can download the workbook using the same file we used in this example.
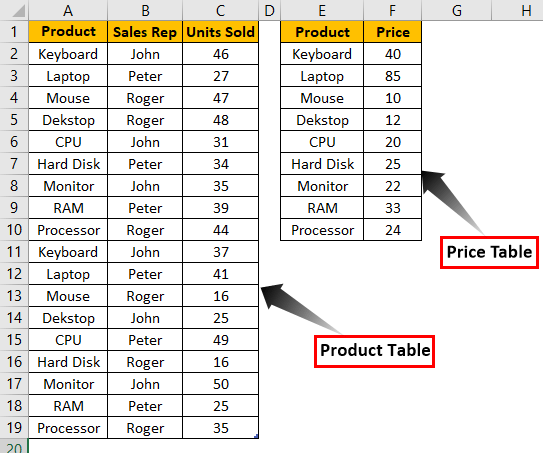
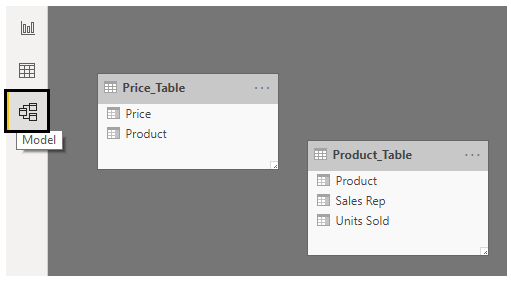
- Above, we have two tables, “Product Table” and “Price Table.” In “Product Table,” we have the product name and units sold details with the “Sales Rep” name for each product.
- In the “Price Table,” we have product names and their price per unit values, so we will use the RELATED function to fetch the price details to “Product Table.”Upload the above two table data to the Power BI Desktop file.
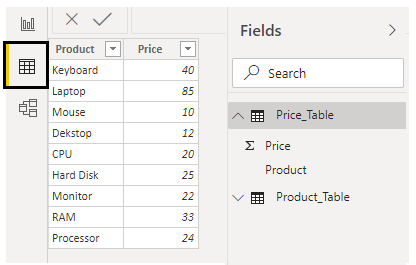
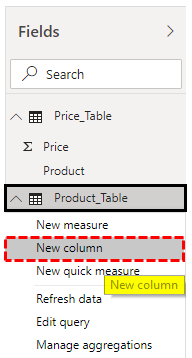
- Now from “Price_Table,” we need to fetch the cost price of each product to the “Product_Table.”Right-click on the “Product_Table” and choose the option of “New column.”
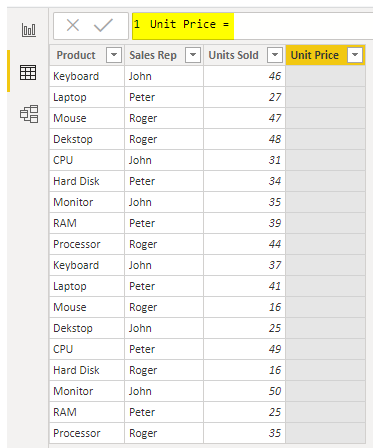
- Now, give the name for the new column as "Unit Price."
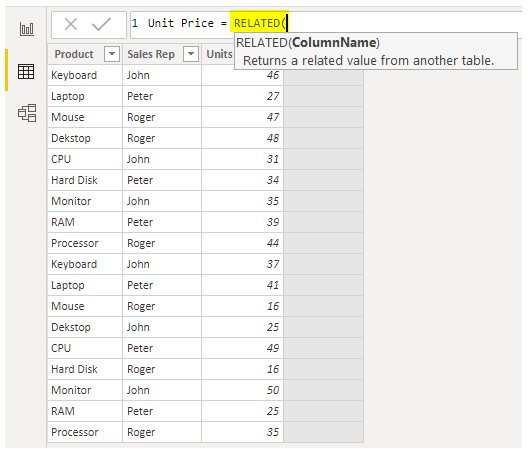
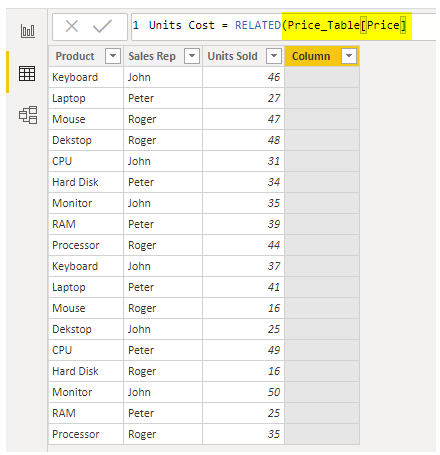
- Open the RELATED function in Power BI.
- We need to choose the column from the "Price_Table," but when you type the table name, we do not see any related searches.
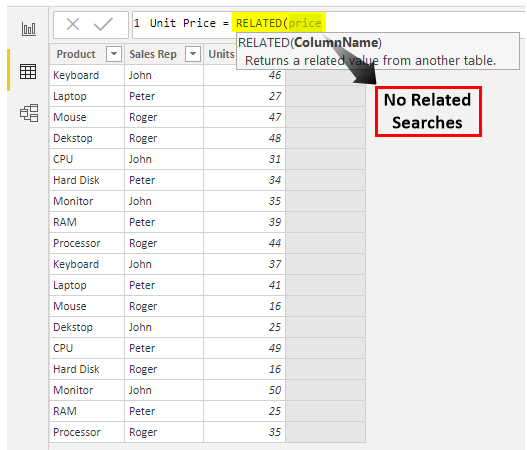
It is because before we use the RELATED function, we must create a relationship between two tables under the "Data Modeling" tab.
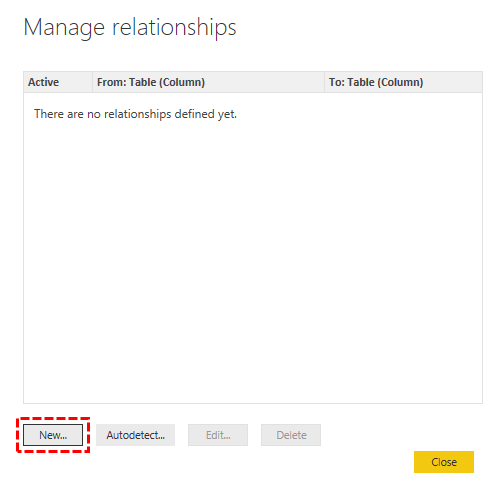
- As you can see above, we do not have any relationship between these two tables. However, we can create the relationship between these two tables by using the common column between these two tables. So in these two tables, the common column is "Product.
Note: Power BI is intelligent enough to create an automatic relationship between two tables based on the column headings when we upload the data tables. Because as a new learner, you need to know about the relationship between two tables, we have removed the relationship.
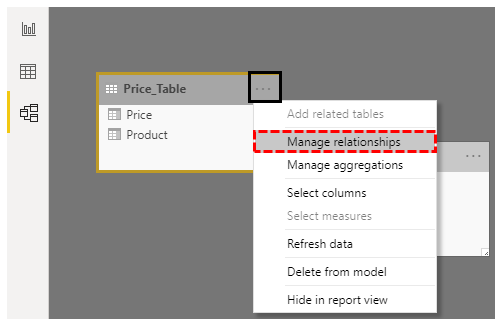
- To create a relationship, click on any of the tables' ellipsis (three dots) and choose “Manage relationships.”
- It will open up the below window for you. Choose the "New" option.
- It will open the "Create relationship" window.
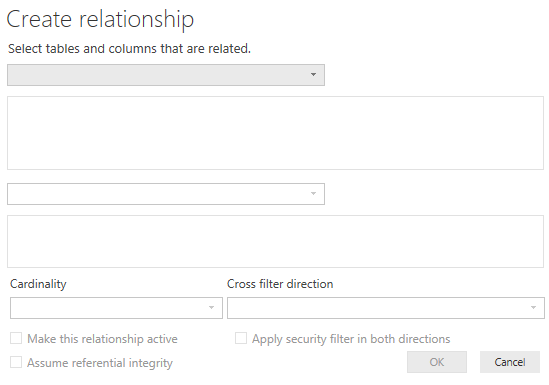
- From the first dropdown list, choose "Price_Table." For example, the table below will automatically choose "Product_Table."
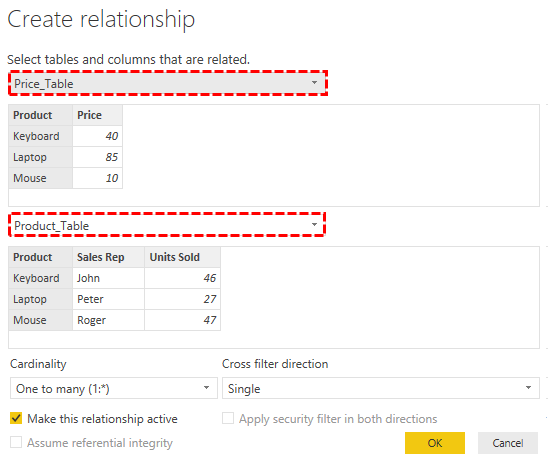
- Choose the common column between these two tables as "Product." Now, click on "OK."
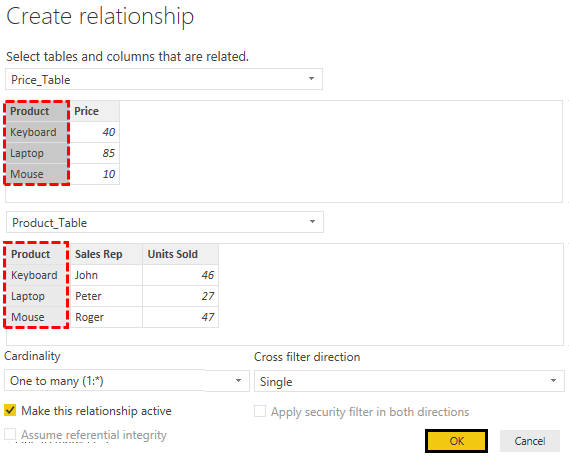
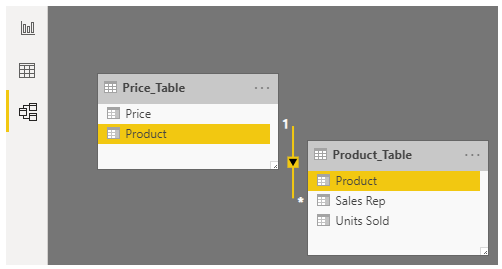
- It will create relationships like the one below.
- Now, return and choose "New column" for "Product_Table" and open the RELATED function.
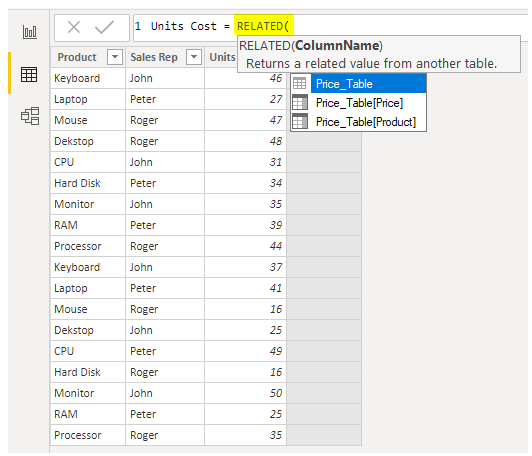
- As you can see above, we have a table name with all the columns of the related table. Choose the “Price_Table ” column from the list.
- Close the bracket and press the "Enter" key to get the price details in the new column.
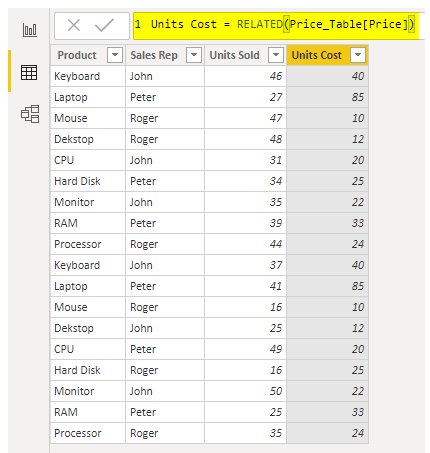
We have a VLOOKUP formula to fetch the details from one table to another based on the common column between tables.
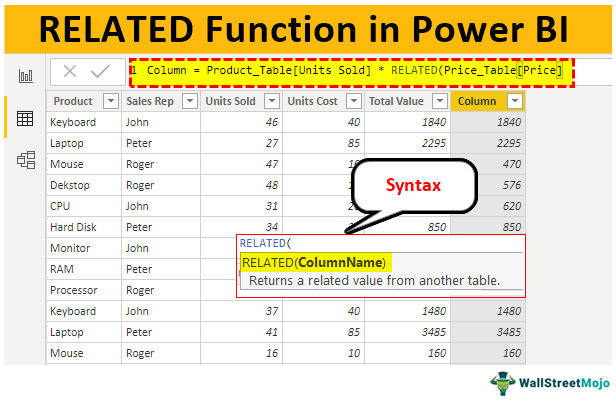
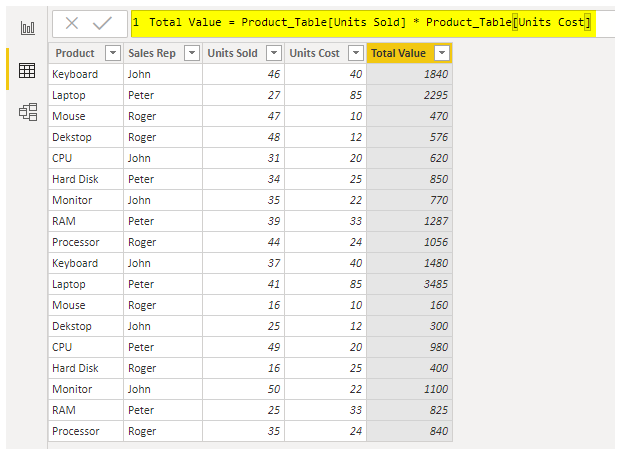
- Since we have fetched price details, we can arrive in new columns as “Total Value” by multiplying “Units Sold with Units Cost.”
- Instead of adding two extra columns, we can arrive at the total value in a single column. Below is the formula to determine the total price in the single step itself.
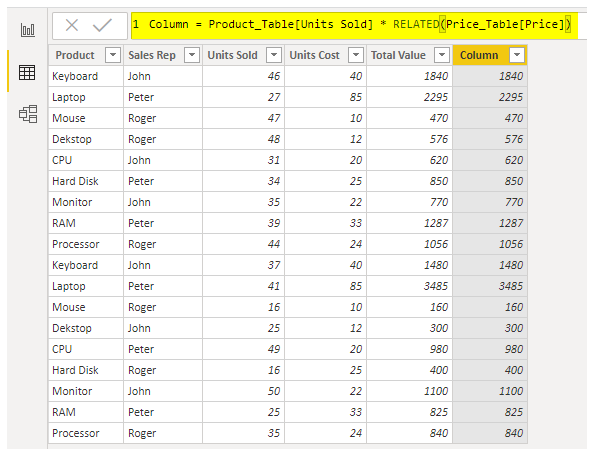
Like this, by using the RELATED function in Power BI, we can fetch the data from one table to the other.
Note: We can also download the Power BI RELATED function file from the link below and view the final output.
Things to Remember Here
- The RELATED function works as VLOOKUP in Power BI.
- The RELATED function can be used if there is any relationship between tables.
- Without a relationship, we cannot even get to see the table name and its column headings.
