Table Of Contents
Parameters in Power BI Report
A parameter is nothing but having different scenarios to look at the outcome of any project. Using a parameter slicer in Power BI, we will be just looking at different kinds of outcomes when the parameter values are increased or decreased.

We hope you have done a What-if Analysis in MS Excel. It is a useful analysis to look at different scenarios when the independent variable changes at certain incremental or decremented rates.
It is possible to do some analysis in Power BI by using the “What-If-Analysis” parameter. This article will show you how to create those parameters in Power BI. For example, assume you are calculating sales value, and you want to know what would be the final sales numbers if you are giving different discount percentages. So, this is possible with the What-If Analysis parameter.
Example of Parameter in Power BI
We will now see how we can use parameters with useful data. You can download the workbook used in this example to practice with us from the link below.
Below is the data we are using for this example.

- Upload the above data table to Power BI. Then, you can see the table as shown below.

- First, we will create a summary table for each city. Then, drag the required "City" and "Total Sales" columns to the "Values" field.

We can view the table in the "Report" tab.

We need to create a parameter to see total sales if the discount is given at different percentage values.
Follow the below steps to create a parameter slicer for a discount amount.
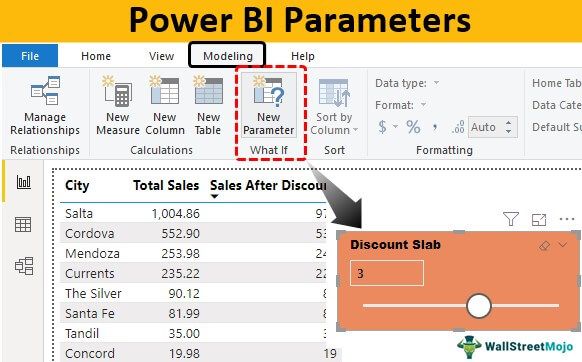
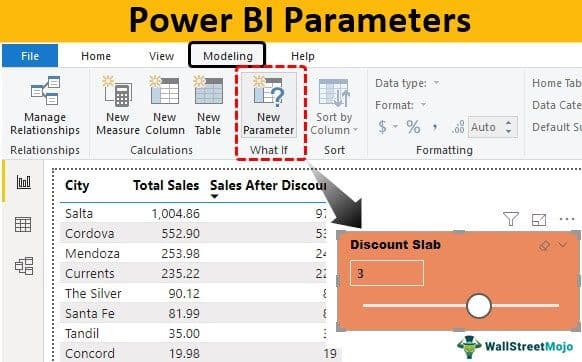
- Step 1: Go to the "Modeling" tab and click on "New Parameter."

- Step 2: We will see the "What-If parameter" window below.

- Step 3: First thing we can do with this window is given a name to our parameter. We are giving the name "Discount Slab."

- Step 4: Next, we could choose the "Data type" option as "Whole number," "Decimal number," and "Fixed decimal number."

We are choosing the "Data type" as "Whole number."

- Step 5: Next, we will decide what the minimum number is and what the maximum number is. In this case, our discount numbers range from 0 to 5, so we will put "0" for minimum and "5" for maximum slabs.

- Step 6: The next option is the "Increment" value, i.e., when the slicer is increased or decreased, what should be the incremental value? In this case, our numbers should increase by 1, and the default value is nothing.

- Step 7: Now, click on "OK." We will have a slicer like the one below.

One more thing you need to notice is that this slicer has an automatic. You need to notice that this slicer has an automatic table created, and that table has two columns: "Discount Slab" and "Discount Slab Value."

These columns are auto-created by two DAX functions: "GENERATESERIES" and "SELECTEDVALUE."
Discount Slab Table

Discount Slab Value Table

The GENERATESERIES function says, "GENERATESERIES(0, 5, 1)," i.e., "Minimum" value is "0", "Maximum" value is "5" and "Increment" value is by "1."
Using this table, we will create new sales values for "Sales Table."
- Right-click on the "Sales_Table" and choose "New measure."

- It will ask us to name the "New measure," so give the name "Sales After Discount."

- Open the SUMX function.

- The first argument of the SUMX DAX function is "Table," i.e., from this table, we are using columns to calculate the "Sales After Discount." In this example, we are concentrating on the "Sales Table," so give reference to this table only.

The next argument is "Expression," i.e., what should be the calculation to conduct. So, what we need to do here is from the "Total Sales" value, we need to deduct the percentage selected from the slicer parameter.
- So first, give reference to the "Total Sales" value column.

- Enter the minus sign (-).

- Now again, select the “Total Sales” column.

- Now, put multiply sign (*).

- We must multiply with "Discount Slab Value" from the "Discount Slab" parameter table.

Note: Press ALT + ENTER to go to the next line in case of lengthy formulas.
Note: Divided by 100 to get the percentage value.
- Press the "Enter" key. We will have a new measure in the "Sales Table."

- Drag and drop new measures to the existing table to see new sales values after discount.

It shows the same values as the old one.
- Now, increase the “Discount Slab” to 3 and see the numbers.

Now, we have a new sales value after deducting 3% of the "Total Sales" values.
Note: We can also download power BI parameters in the report file from the link below and view the final output.
Things to Remember Here
- In Power BI, parameters are used to conduct a What-if Analysis.
- We can also set the minimum and maximum parameters and data type numbers.
- When the parameter is set, a new table will be created by using DAX functions.
- The new value needs to be created as a "New measure," not as a "New column."

