Table Of Contents
What is DAX in Power BI?
DAX stands for "Data Analysis & Expression." DAX is a functional language representing all Excel and Power BI functions. In simple terms, we can call it "Function Representor." Using DAX language, we can create formulas in Power BI. Understanding DAX formulas would not be difficult if you are familiar with Excel formulas.

Data visualization is the need of the hour. Here we go. We have a "Microsoft Power BI" as the data visualization tool.
We have used MS Excel for numbers crunching, data analysis, and visualization. But now we have Power BI for visualization. With a simple drag and drop technique, we can create our visualization of the data. This article will show you the DAX function and how to start with it in Power BI.
Upload Data to Power Bi
You can download the workbook used in this example to practice with us from the link below.
Below is the workbook data we are using.

It is huge data. You can download the workbook here.
- Now, open Power Bi software and click on "Get Data">>> "Excel."

- Now, the file picker window will come. Choose the downloaded file from the same location.

- You can see worksheet names and tables in the selected Excel workbook as soon as you choose the file.

- In the workbook, we have named the table "Sales," so choose the same. Then, you will see the preview on the right-hand side and click on the "Upload" option.

- It will take some time to upload since the data is large. After the upload, you will see the below window.

- On the right-hand side of the window, you will see the "Fields" list, which shows all the data headings in the selected table.

Now with this data, we need to play around by using DAX functions in Power BI.
DAX Calculation in Power BI
If you see the data, we have "Total Units," "Sale Price," and "Cost Price" only. So, we need to find "Total Sales," "Total Cost," "Gross Profit," etc.
First, let us calculate "Total Sales."
- Right-click on the table name "Sales" and choose "New column."

- Now, the "New column" will open like the one below.

- Now, give a name to this as "Total Sales" and put an equal sign.

- Now, apply the formula as "Total Units * Sales Price."

As you can see above formula says "Sales * Sales ."
- Here, "Total Sales" is the table name of the inserted table. So now, we can view this new column in the "Fields" list under the "Total Sales" table.

- Take "Card" visualization and insert a newly created column, Total Sales.

- Then, the card looks like as shown below:

- So, our first DAX calculation is working fine. Now again, right-click the "Sales" table name and choose "New Column" for "Total Cost."

- The "Total Cost" formula is "Total Units * Cost Price."

- Now, the newly created column appears. We inserted one more card for this DAX column as well.

- Find the "Gross Profit" amount using the formula: Total Sales – Total Cost.

- Now, arrive at Gross Profit using this formula: Gross Profit / Total Sales *100.

Now, we will see how to use some basic functions in Power BI DAX.
Functions in DAX Power BI
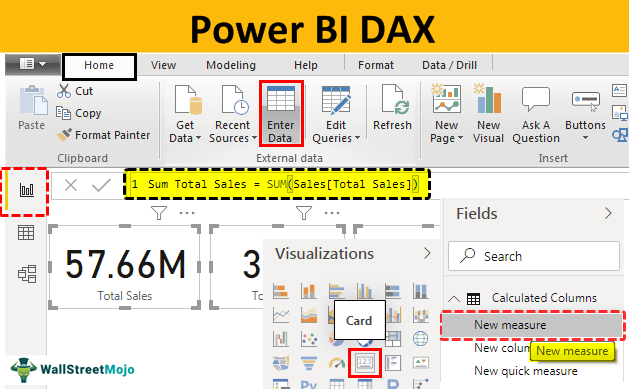
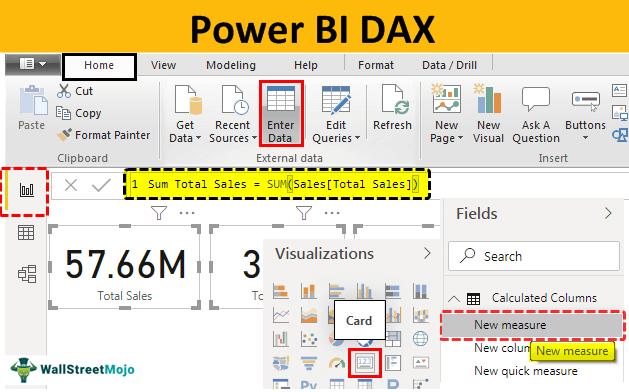
To store all the calculated fields, let us create a new measure. First, click on the "Enter Data" option under the "Home" tab.

- Now, create a table that comes up, which gives a name as "Calculated Columns," and click on "Load."

- Now, we can see a new table name in the fields.

- First, we will use the SUM function for some of the columns. Then, as usual, right-click on the new table name and choose "New measure."

It pop-ups in the "Formula bar."

- Before we open the SUM function, we need to give a name for this column. Since we are adding "Total Sales," give the name "SUM Total Sales" and then open the SUM function.

- As you can see, the argument of the SUM function is "ColumnName," i.e., which column you need to SUM. Now, select the "Total Sales" column.

It also works the same way previous "Total Sales" works. But, previous sales calculate the sales as Units * Sales Price. So, since "Total Sales" already has the sales amount, this SUM function adds all the values of the "Total Sales" column. Like this, we can use DAX functions in Power BI.
Note: We can also download the Power BI DAX function file from the link below. We can view the final output.
Things to Remember Here
- It is the beginner's guide for DAX. We will discuss more of these DAX functions in Power BI in upcoming articles.
- Power BI is a visualization tool to visualize data.

