Table Of Contents
What is Portfolio Variance?
The term "portfolio variance" refers to a statistical value of modern investment theory that helps measure the dispersion of average returns of a portfolio from its mean. It can be derived based on a weighted average of individual variance and mutual covariance. In short, it determines the total risk of the portfolio.

Key Takeaways
- Portfolio variance is a statistical measure that assesses the extent of deviation in the average returns of a portfolio from its mean.
- It quantifies the overall risk by considering the individual variances of assets and their correlations within the portfolio.
- Portfolio variance is computed using a formula involving asset weights, individual variances, and correlations.
- It offers a comprehensive view of how assets interact within a portfolio, reflecting diversification and interdependence.
- A higher portfolio variance indicates greater volatility and risk. Lower variance suggests a more stable portfolio.
- Investors analyze portfolio variance to make informed decisions about diversification and risk management.
Explanation of the Portfolio Variance Formula
The portfolio variance formula of a particular portfolio can be derived by using the following steps:
- Firstly, determine the weight of each asset in the overall portfolio, which is calculated by dividing the asset value by the total value of the portfolio. Wi denotes the weight of the ith asset.
- Next, determine the standard deviation of each asset, which is computed based on each asset's mean and actual return. The standard deviation of the ith asset is denoted by oi. The square of the standard deviation is variance i.e., oi2.
- Next, determine the correlation among the assets, and it captures the movement of each asset relative to another asset. The correlation is denoted by ρ.
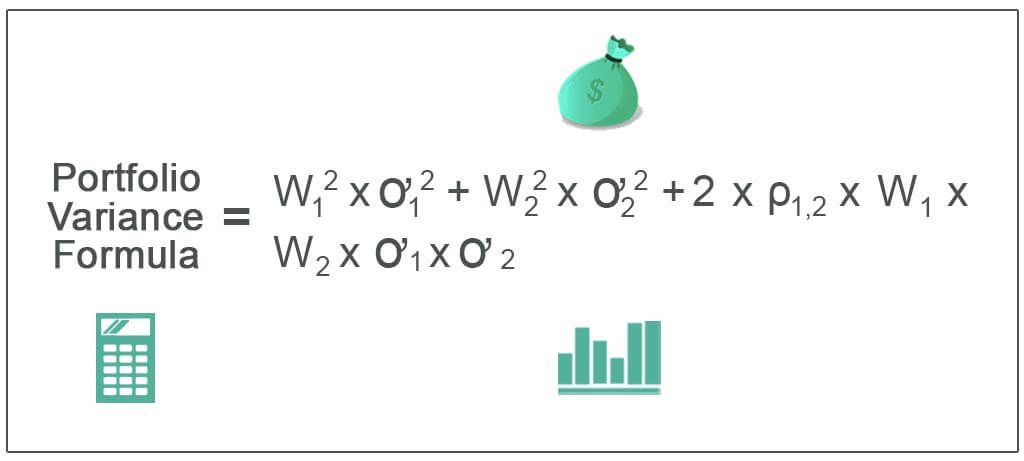
- Finally, the portfolio variance formula of two assets is derived based on a weighted average of individual variance and mutual covariance, as shown below.
Portfolio Variance formula = w1 * ơ12 + w2 * ơ22 + 2 * ρ1,2 * w1 * w2 * ơ1 * ơ2
Example of Portfolio Variance Formula (with Excel Template)
Let us take the example of a portfolio that consists of two stocks. The value of stock A is $60,000, and its standard deviation is 15%, while the value of stock B is $90,000, and its standard deviation is 10%. There is a correlation of 0.85 between the two stocks. Determine the variance.
Given,
- The standard deviation of stock A, ơA = 15%
- The standard deviation of stock B, ơB = 10%
Correlation, ρA,B = 0.85
Below is data for the calculation of the portfolio variance of two stocks.

Weightage of Stock A, wA = $60,000 / ($60,000 + $90,000) * 100%

Weightage of Stock A = 40% or 0.40
Weightage of Stock B, wB = $90,000 / ($60,000 + $90,000) * 100%

Weightage of Stock B= 60% or 0.60
Therefore, the portfolio variance calculation will be as follows,

Variance = wA2 * ơA2 + wB2 * ơB2 + 2 * ρA,B * wA * wB * ơA * ơB
= 0.4^2* (0.15)2 + 0.6 ^2* (0.10)2 + 2 * 0.85 * 0.4 * 0.6 * 0.15 * 0.10

Therefore, the variance is 1.33%.
Relevance and Use
One of the most striking features of portfolio var is that its value is derived based on the weighted average of the individual variances of each asset adjusted by their covariances. This indicates that the overall variance is lesser than a simple weighted average of the individual variances of each stock in the portfolio. It is to be noted that a portfolio with securities having a lower correlation among themselves ends up with a lower portfolio variance.
Understanding the portfolio variance formula is also important as it finds application in the Modern Portfolio Theory, which is built on the basic assumption that normal investors intend to maximize their returns while minimizing the risk, such as variance. An investor usually pursues an efficient frontier, the lowest level of risk or volatility at which the investor can achieve its target return. Most often, investors would invest in uncorrelated assets to lower the risk as per Modern Portfolio Theory.
There are cases where assets that might be risky individually can eventually lower the variance of a portfolio because such an investment is likely to rise when other investments fall. As such, this reduced correlation can help reduce a hypothetical portfolio's variance. Usually, the risk level of a portfolio is gauged using the standard deviation, which is calculated as the square root of the variance. The variance is expected to remain high when the data points are far away from the mean, which eventually results in a higher overall level of risk in the portfolio, as well.

