Table Of Contents
What Is A Poisson Process?
The Poisson Process refers to the counting of occurrences of a specific event with no definite structure but with measurable probability. The events are certain, occurring at a constant rate in a random manner, and are independent of each other. It means the previous event does not influence the present or next event. Also, the timing of one occurrence or instance does not affect or alter the timing of the next event.
It is an important concept in business since counting indicates how many times an event occurs. Companies need this data to measure, evaluate, and improve business processes. It can be seen routinely in other areas, too, including day-to-day activities and natural sciences. It is based on the theory of Poisson Distribution and is also called the Poisson Point Process. The Poisson mean is represented by lambda (λ), which denotes the number of events taking place in a specific time or setting.
Key Takeaways
- The Poisson process is a stochastic counting method that tracks events or occurrences but does not show the exact interval between two independent events. Probability distribution shows the time that lapses between two independent events.
- The model is based on the Poisson distribution developed in 1837 by a French mathematician, Simeon Denis Poisson. Hence, it was named after him.
- This concept occupies an important place in business, government planning, and engineering, among other fields and functions.
- It is usually applied alongside other methods during analysis as the outcomes from this process may not be accurate at all times, given fluctuations in data collection and quality.
Poisson Process Explained
The Poisson process is a counting methodology that determines how many times a series of discrete events with no exact timing or structure occur. However, the average time or rate between two events is known. The base concept of Poisson Distribution was proposed by French mathematician and statistician Simeon Denis Poisson in 1837. His work in probability theory is widely acknowledged.
Poisson distribution is closely connected with the Poisson process. While the process denotes stochastic modeling and notes the events occurring in a given period, the occurrence observed during the process is presented in the form of a Poisson distribution (probability distribution) to count the number of events occurring in a specific period, along with the interval of occurrence.
The Poisson process definition states that each event is treated as an independent variable with no impact or influence of the previous event on the current or next event and works on the assumption that two events cannot occur simultaneously. It is a well-known counting model used in various industries. Businesses use this model to gauge performance and growth. For instance, a manager can use it to count the number of customers walking in a store, the rate at which goods are sold, etc. Other statistics, such as the number of email subscriptions and website performance (traffic, downtime, online inquiries, etc.), can also be analyzed with this method.
Government agencies and departments employ this method to analyze and understand specific occurrences in a given environment or situation. For instance, car accidents on a particular stretch of the road can be observed. It is also used to track the occurrence of natural disasters like earthquakes.
The process considers events bound to happen at some point, though the exact time remains unknown. The Poisson process formula is a probability function that helps predict an event's occurrence. Other statistical and analytical methods are generally employed due to data inaccuracy or lack of inclusive data. This enables researchers, analysts, and businesses to arrive at more precise results.
Properties
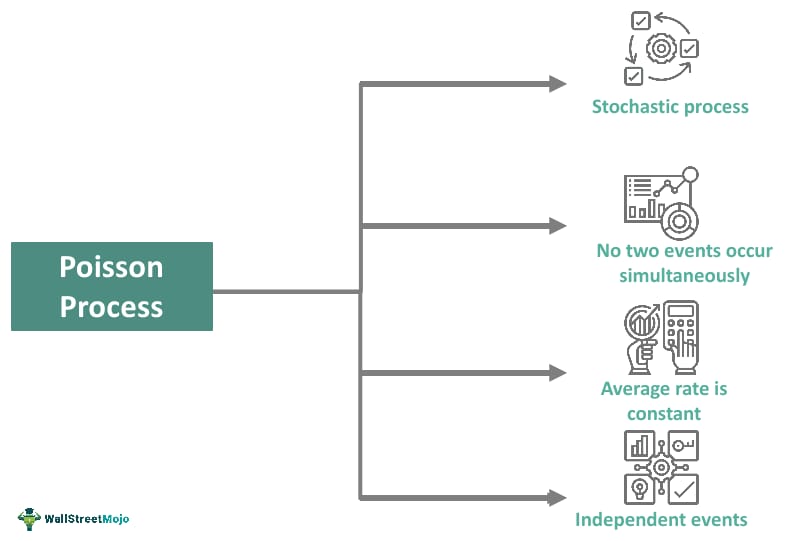
The properties of this process are listed below.
- The events are independent, meaning no event influences the present, next, or another event. No event impacts future occurrences.
- The model facilitates the counting of random events occurring in a specific period.
- The average rate of occurrence between two events remains constant. This occurrence rate is denoted as “λ” (lambda), showing the average number of events in a given period or time frame.
- No events are connected. Hence, two events cannot occur at the same time. The events are either a success or a failure.
- The Poisson process cannot be negative as it starts with a random event in a distinguishable time frame.
Examples
Below are two hypothetical examples of this process that enable readers to understand the concept better.
Example #1
Suppose a grocery store observes a daily walk-in number of 135 customers. The store is open from 9:00 AM to 9:00 PM. Though the count of walk-ins in these 12 hours is clear, the frequency or time interval of this occurrence is not. The Poisson process, in conjunction with probability distribution, helps detect the time interval between two customers walking inside the store. It states that no two customers will walk in at exactly the same time. Therefore, it helps the store manager identify the mean, which is 11 per hour (11.25).
The entry of one customer does not affect or influence the other customer, which means every customer is treated as an independent variable. The theory also suggests that the occurrence of people coming to the store is strictly random, but the average interval rate remains constant. Based on the counting function, the Poisson distribution calculates the probability of the next customer arriving at specific intervals.
Example #2
This is another hypothetical situation: A particular island city is known for its beaches but is prone to natural disasters. It has been observed that tsunamis (a natural occurrence) hit the city around four times a year. Researchers use the Poisson process and distribution model to count the tsunamis and estimate the time intervals between two occurrences.
Tsunami counting satisfies the properties of the Poisson process; they are a series of discrete events with a known average time interval. However, the exact timing is random. Each new tsunami is independent of past occurrences. Probability distribution helps the government predict the time interval from one occurrence to the next. They use this information to finalize evacuation plans.
Applications
The applications of this concept have been discussed in this section.
- The Poisson process helps identify the interval between two independent but similar events. Hence, it can be used in business, particularly in functions like customer service, marketing, inventory control, production quality control, etc. Fields like logistics, hospitality, manufacturing, etc., also benefit from this evaluation.
- The counting process enables businesses to count events without a certain structure, such as website traffic levels, online sign-ins, online shares, online content delivery, etc.
- In finance, this process can be used to analyze and estimate events affecting financial markets. Banks can use it for estimating non-performing assets in a given period.
- Resource allocation across various functions and industries is possible due to this process. For instance, it can help estimate the number of people visiting a retail store, and based on this information, the manager can assign personnel to attend to customers visiting the retail store.
- It supports gamma distribution and exponential processes in engineering, science, and business.
- The model helps forecast events like natural disasters, helping the government formulate rescue plans.
Poisson Process vs Poisson Distribution
The main differences between the Poisson process and Poisson distribution are listed below.
- The Poisson process represents the number of random events occurring at specific intervals. In contrast, Poisson distribution is a probability distribution model predicting the waiting period or the timing of random events in a given period.
- The Poisson process is continuous as it shows the occurrence of events but not the time that separates these events. However, the Poisson distribution is a discrete probability distribution that shows the interval between two occurrences of the same kind.
- It is stochastic, generally plotted on a real line representing time. The Poisson distribution is visualized on a graph as a probability mass function.
