Table Of Contents
What Is A Point And Figure (P&F) Chart?
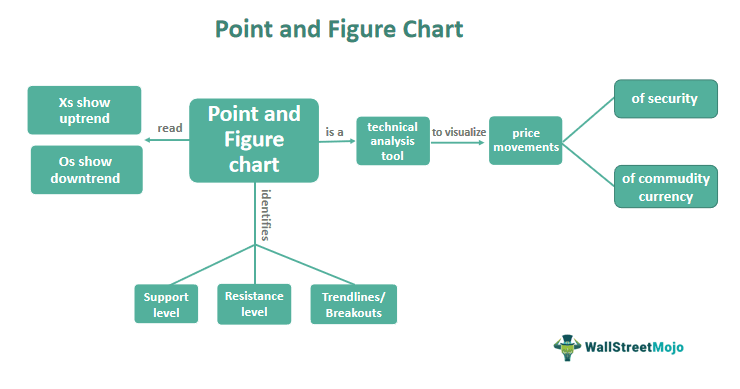
A Point and Figure (P&F) chart is a technical analysis tool that uses Xs and Os to represent bullish and bearish price movements, respectively, and plots only significant price changes.. It provides a simplified view of price movements while removing noise and helping to identify important market signals.
P&F charts help identify support and resistance levels, trendlines, and breakouts. They provide traders with an easy-to-use visual representation of market trends, making it easier to identify entry and exit points, manage risk, and make more informed trading decisions. Thus, making it a popular charting technique among traders and investors.
Table of contents
- What Is Point And Figure (P&F) Chart?
- P&F charts are a charting technique used in technical analysis to provide a simplified view of price movements by plotting only significant price changes.
- P&F charts can be customized based on an individual trader's preferences and are useful for identifying important support and resistance levels, trendlines, and breakouts.
- P&F charts have advantages, such as providing a simplified view of price movements and removing noise, but also have disadvantages, such as providing less information and being subject to delay and subjectivity.
- Overall, P&F charts can be useful for traders to make informed trading decisions, but it's important to be aware of their limitations and potential biases.
Point And Figure Chart Explained
A Point and Figure (P&F) chart is a charting technique used in technical analysis to visualize the price movements of a security, commodity, or currency. The chart consists of columns of Xs and Os representing bullish and bearish price movements, respectively. The Xs represent an uptrend, while Os represent a downtrend. Each X or O represents a certain price increment, determined by the box size and reversal criteria the analyst sets.
Unlike traditional candlestick or line charts, P&F charts only plot significant price movements, ignoring the insignificant ones. As a result, P&F charts are useful for identifying important support and resistance levels, trendlines, and breakouts, which can help traders make more informed trading decisions. P&F charts can be used for any timeframe, from minutes to years, and customized based on an individual trader's preferences. P&F charts are popular among traders and investors due to their simplicity and effectiveness in identifying trends and reversals.
How To Trade?
To trade using Point and Figure (P&F) charts, a trader can follow these steps:
- Select a P&F charting platform or software that suits personal needs and preferences.
- Choose the financial instrument to trade and set the P&F chart parameters, including the box size and reversal criteria.
- Analyze the chart to identify important support and resistance levels, trendlines, and breakouts.
- Develop a trading plan and strategy based on the analysis and risk tolerance.
- Execute trades using the trading platform, and manage trades by setting stop-loss order and take-profit orders based on the analysis of the P&F chart.
- Monitor the trading performance and adjust the trading plan as needed.
Remember that P&F charts can be customized to suit the trading style. Also, it is important to understand the charting technique and interpretation before using it to make trading decisions.
Chart
Let us look at this Euro/US Dollar chart to understand the concept better.

In the above chart, the O columns and X columns represent the price movements. Each of the columns denotes a downtrend or uptrend of sorts, and every X column precedes an O column. Moreover, as one can observe, every O and X occupies a box in the price chart, with each of the boxes equal to a specific level of price. Unlike other price charts, these are timeless as they do not factor in time.
From the above chart, the overall upward trend is clear. This is because the X columns are overall longer when compared to the O columns.
One can view charts like these on the TradingView website to ensure they develop a comprehensive understanding of the concept.
Examples
Let us look at the examples to understand the concept better:
Example #1
Here's an example of how to use a Point and Figure (P&F) chart to make a trading decision:
Suppose a trader wants to trade stock XYZ using a P&F chart. It has parameters of a box size of $0.50 and a reversal criteria of 3 boxes. After analyzing the chart, the trader notices that the stock has formed a bullish triangle pattern. It has higher lows and a horizontal resistance level of $60.
Based on the analysis, the trader decides to enter a long position in the stock, setting the stop-loss order below the most recent low at $55 and the take-profit order at $68, the height of the triangle added to the breakout point at $60. The trader also decides to monitor the chart closely for any signs of a reversal or a change in trend.
As the stock price rises, the take-profit order gets a trigger, and the trader exits the position with a profit. This is an example of how a P&F chart can identify important patterns and levels in the market. This helps make informed trading decisions based on analysis.
Example #2
Let's say that a stock is trading at $100 per share, and the minimum price movement required to create a new column in the point and figure chart is $5. A new column of X's will be created if the stock's price increases to $105.
In the first column, there will be 4 Xs representing the price range of $100 to $85. In the second column, there will be 4 Xs representing the price range of $105 to $90. If the stock continues to rise to $110, another column of X's will be created, and so on.
Conversely, a new column of O's will represent the downward movement if the stock's price decreases by $5 to $95. Each column will have either X's or O's, but not both, and they will alternate depending on the direction of the price movement.
Advantages And Disadvantages
Let us have a look at the main advantages and disadvantages of the P&F chart.
Advantages
- A simplified view of price movements: P&F charts provide a simplified view of price movements, making it easier for traders to identify important market signals, such as trendlines and support and resistance levels.
- Removes noise: P&F charts only plot significant price movements, ignoring the insignificant ones. This can help traders filter out the noise and focus on important market movements.
- Customizable: P&F charts are customizable to suit an individual trader's preferences and trading styles, such as setting different box sizes and reversal criteria.
Disadvantages
- Less information: P&F charts provide a simplified view of price movements. They provide less information than other charting techniques, such as candlestick charts.
- Delayed signals: P&F charts are based on significant price movements, so they may not provide signals as quickly as other charting techniques plotting all price movements.
- Subjectivity: The selection of box size and reversal criteria for a P&F chart can be subjective, leading to different interpretations and results among traders.
- Limited indicators: P&F charts do not provide as many technical indicators as other charting techniques, limiting the information available for traders to make informed trading decisions.
For professional-grade stock and crypto charts, we recommend TradingView – one of the most trusted platforms among traders.
Disclosure: This article contains affiliate links. If you sign up through these links, we may earn a small commission at no extra cost to you.

Frequently Asked Questions (FAQs)
To read a Point and Figure (P&F) chart, identify bullish Xs and bearish Os, use the box size and reversal criteria to plot price movements, and identify support and resistance levels.
Point and Figure (P&F) charts work by plotting only significant price changes using Xs and Os. These charts are helpful for traders to make informed decisions by identifying support and resistance levels, trendlines, and breakouts.
To use Point and Figure (P&F) charts for intraday trading, set the box size and reversal criteria based on the preferred timeframe, and use the chart to identify key support and resistance levels and potential entry and exit points.
Several patterns are found in Point and Figure (P&F) charts, including double tops and bottoms, bullish and bearish trendlines, breakouts, and reversals. These patterns can help traders make informed trading decisions.
