Table Of Contents
What Is Percent Change In Excel?
Percent Change in Excel, as the name suggests helps users find the changes between two values (old value and new value) in the data.

For example, ABC Co. achieved a revenue of $15K in the previous week. However, the current week's revenue is $20K. What is the percentage change in revenue compared to the last week?
In this example, we have two numbers: previous week and current week. As per the formula, the old value is the previous week's number, and the new value is the current week's number.
Percent Change = (New Value – Old Value) / Old Value
- Percent Change = (20,000 – 15,000) / 15,000
- Percent Change = 5,000 / 15,000
- Percent Change = 33.33%.
We can do the same calculation by using simple Excel formulas. Now, we will see how to solve these problems in an Excel worksheet.
Key Takeaways
- Percent change in Excel is used to find the difference between two values. The two values must be the old and new value of a particular data.
- The percent change formula in Excel is calculated by Percent Change = (New Value – Old Value) / Old Value OR Percent Change = New Value / Old Value – 1.
- A minimum of two numbers are required to calculate percentage change.
- The percentage change can be positive or negative, and it is essential to use a red color format for negative percentage changes.
Syntax
The syntax of percent change in Excel is
Percent Change = (New Value – Old Value) / Old Value
OR
Percent Change = New Value / Old Value – 1
How To Calculate Percent Change In Excel?
We need at least two numbers from different periods to calculate the percent change in Excel. Below is the formula to calculate the percent change in general.
Examples
Example #1
Below is the revenue every year for the past 10 years.

So, from this data, we need to find the year on the year percentage change in revenue. Then, copy the above data to a worksheet.
Here, the first-year percentage change is nil because to compare that year's number, we need the previous year's number, so it is unavailable. From the second year onwards, we can calculate the percentage difference in excel.
Apply the basic excel formula as (New Value – Old Value) / Old Value.

It will calculate the percentage change in revenue between 2008 and 2009.

So, revenue has decreased by -15.75% from 2008 to 2009.
Copy and paste the formula to the remaining cells to see the year on percent change.

Apply the below formatting to see the negative percentage in red color.

We get the following result.

It is one way of finding percentage change year on year. Another way of finding the percentage change is between the base year (first year) and the remaining year.
For this, our formula's old value remains the same for years. In this data, the old value is the year 2008.

Apply the above formula to the remaining cells to see the percentage change between the first year and last year.

So, from the first to last year, revenue has decreased by 20.98%. But, on the other hand, the revenue increased only in 2016 by 10.08%, which is the highest.

Example #2
We have seen how to calculate the percentage change between two values. Now, we will see how to increase the number by a certain percentage.
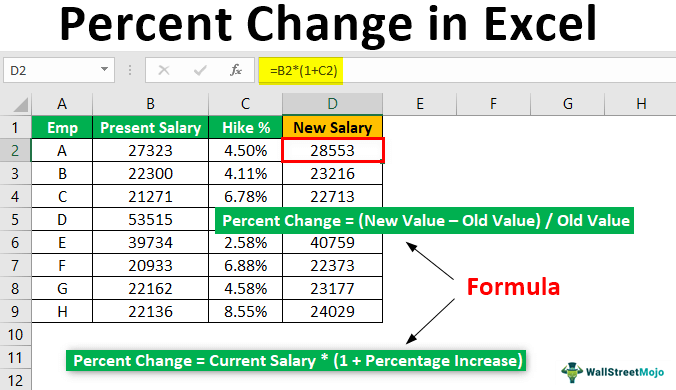
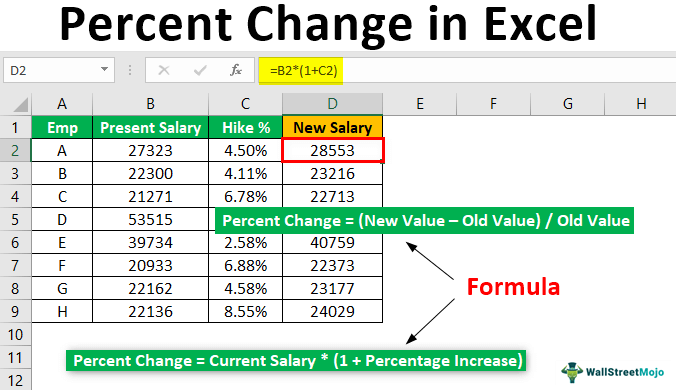
Assume you are working in HR. You have received a salary increment percentage after appraisal. You have a current salary, and also, you are provided with what percentage hike is given. Using this, you need to calculate a new salary.

This example is slightly different from what we have seen in the above example. Here, we need to increase the number by a certain percentage.
Below is the formula to increase the value by a certain percentage.
Apply the same logic for the below data as well.

We get the following result.

Apply the formula above to all the cells to get the new salary value.

Let me explain to you how this formula works.
The first formula reads like this B2*(1+C2)
= 27323*(1+4.5%)
= 27323*(1.045)
= 28553.
Example #3
Consider the below table showing the salary of people in an organization.

Now, let us learn the method to find the percent change in Excel.
The steps are:
Step 1: To start with, select the cell to insert the formula. In this example, let us select cell D2.
Step 2: Next, insert the percent change in Excel.
The formula is =B2*(1+C2)

Step 3: Press Enter key. We can see the result as shown in the below image.

Next, using Autofill option, we can find the result in the cell range, D3:D9.

Likewise, we can find percent change in Excel.
Important Things To Note
- The percentage change requires at least two numbers.
- The percentage change could be positive as well as negative.
- We must always apply a red color format for negative percentage change.

