Table Of Contents
PEG Ratio Meaning
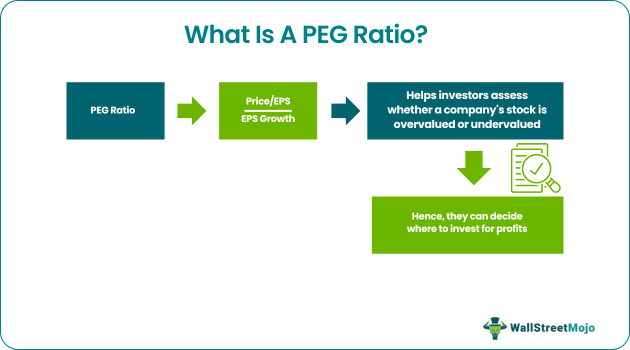
The Price/Earnings to Growth ratio, or PEG ratio, is a tool that helps assess how appropriate the valuation of a company’s stock is, given its current market value and future potential. This ratio lets investors figure out if stocks of a company are overly priced or undervalued.

In the process, the investors can separately calculate the price/earnings ratio and compare it with the PEG ratio. This comparison helps them find out the difference between how much should be the price of a stock and at what rate it is currently being traded in the market.
Key Takeaways
- PEG ratio serves as a metric to determine whether a company's stock prices are overvalued, undervalued, or fairly priced.
- It is a ratio within a ratio as the price/earnings ratio is first calculated, then the result is divided by the company's expected growth rate.
- A lower ratio specifies that a business or its stock price is undervalued based on its earnings performance.
- In contrast, a higher one generally stipulates that a business is currently overvalued.
PEG Ratio Explained
A PEG ratio acts as a factor that determines how accurately a company decides on the price at which its stocks should be traded. It is a ratio within a ratio as users have to find out the price/earnings ratio first to see how it relates to a company’s expected growth. Accordingly, the the stocks of the companies that are expected to have a better market value, increased cash flow, and enhanced future potential, trade at a higher rate.
When investors assess all the factors and check that the decided stock price is justified, they agree to proceed with the trade. Else, they skip the deal as they feel the stocks are overrated. This is because investors are always ready to invest in assets with better growth potential as they know that those companies’ stock prices will only increase with time, helping them reap more profits.
A lower price/earning-to-growth ratio usually specifies that a business is undervalued based on its earnings performance. In contrast, a higher price/earnings-to-growth ratio generally stipulates that a business is currently overvalued.
It states that to be fairly valued or priced, the price/ earning-to-growth ratio should either be equal to the growth rate of earnings per share or should be one.

Image Source: Financial Modeling and Valuation Course Bundle
Infosys was trading at a very high PE Ratio in 1997-2000. However, most analysts during that time recommended a BUY for this stock as they looked at another valuation parameter in conjunction with the P/E ratio, i.e., the price/earnings-to-growth ratio. PEG ratio helps determine a stock’s value while considering earnings growth. Infosys was growing exponentially during that period. Hence, the ratio provided valuable clues to the analyst about its fair valuation.

Video on PEG Ratio
Formula
Here is the PEG ratio formula used to check if the stocks are appropriately priced:

EPS, here, is the Earnings Per Share for the companies.
Interpretation
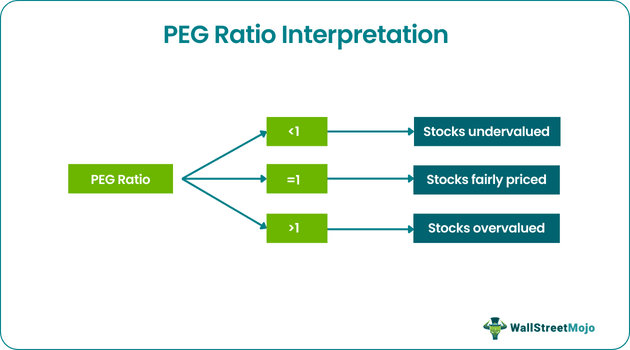
If the price/earnings-to-growth ratio equals 1, it states the business is fairly priced or valued. On the other hand, if the price/earnings-to-growth ratio is less than 1, it signifies an undervaluation of the business.

Moreover, if the price/earnings-to-growth ratio is more than 1, it indicates overvalued stocks of a business. For example, Apple's PEG ratio and Tesla's PEG ratio for the upcoming five years as expected are 2.67 and 1.98, respectively, as of July 22, 2022, indicating their overvalued stocks.
Examples
Let us consider the following examples to understand how the concept works:
Example 1
Andy Co.'s equity shares trade in the market at $54 per share with earnings per share of $6. The dividend payout of the company is 72%. It has 100,000 equity shares of $10 each and no preference shares. The book value of shares is $42. The growth rate of earnings per share is 10%. Let us calculate the price/earnings-to-growth (PEG) ratio of Andy Co. and analyze its impact.
Market price per share =$54
Earnings per share (EPS) = $6
Price-to-earnings (P/E) ratio = Market price per share/Earnings per share
= $54/$6
= 9
PEG ratio = P/E ratio/Growth rate of earnings per share
= 9/10
= 0.9.
The price/earnings-to-growth ratio of Andy Co. is 0.9. Therefore, as the ratio is less than its growth rate or one, it will be stated as undervalued.
Example 2
Investor Mr. A is looking forward to investing. But he is under confusion whether to invest in the stocks of company X or Y. After consulting his mentor; he decided to find out the PEG ratios of the companies separately. Hence, the trader noted down the details separately for both the companies in a tabular form for a comparative view:
| Category | Company X | Company Y |
|---|---|---|
| Price per share | $50 | $60 |
| EPS current year | $3.0 | $2.10 |
| EPS last year | $2.4 | $1.90 |
Company X
To calculate the PEG ratio, the investor first calculates the P/E ratio:
P/E Ratio = $50/3.0
= 16.67
Then, he calculates the expected earnings growth rate = (3/2.4) - 1
= 1.25 – 1
= 25%
Finally, he has the two determinants to calculate the PEG ratio:
PEG Ratio = 16.67/25
= 0.66
Company Y
The investor carries out the same procedure for this company. To calculate the PEG ratio, the investor first calculates the P/E ratio:
P/E Ratio = $60/$2.10
= 28.57
Then, he calculates the expected earnings growth rate = (2.10/1.90) - 1
= 1.105 – 1
= 10.5%
Finally, he has the two determinants to calculate the PEG ratio:
PEG Ratio = 28.57/10.5
= 2.72
Though the stock prices of company Y seem to be more attractive, investors may still be doubtful, given the difference in the growth rate of the two companies. Therefore, the investor decides to go with company X stocks as the ratio signified fair pricing, and even the growth rate shows that stock value is justified and reliable.
Relevance
The PEG ratio provides investors a more refined look at a future investment value since an irresistibly high P/E ratio does not inevitably hold up under scrutiny once you consider the company's growth rate.

The price/earnings-to-growth ratio can show how costly or cheap a company's stock is with respect to the rising rate of its earnings. In addition, it also indicates the rate at which the prices are anticipated to hike over the long term.
That recommends great merit over computing a firm's price/ earnings (P/E) ratio individually since that amount only considers the company's value in terms of its current earnings. Nevertheless, one must remember that the PEG ratio comes with certain limitations, for example limited applicability to dividend or values investors. More of such drawbacks are discussed in the Valuation Course.

