Although both are part of a regression family, they differ in certain aspects. Their significant differences are listed in the table below:
Table Of Contents
What Is Ordinal Regression?
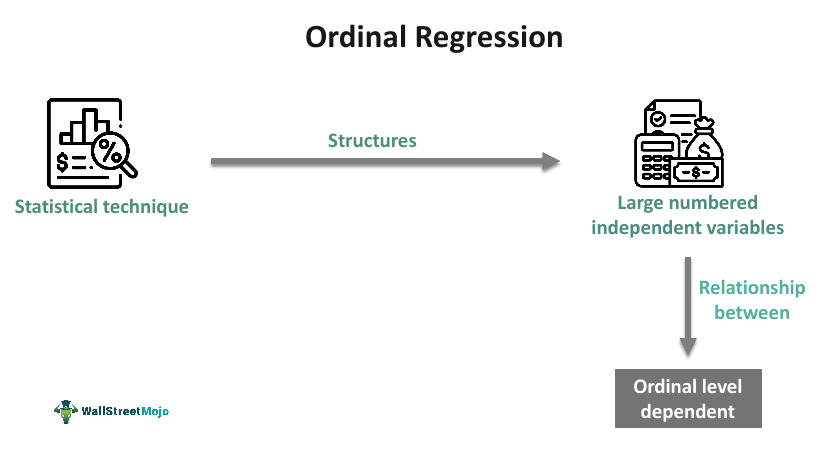
Ordinal Regression is a statistical method designed to explore the relationship between one or more independent variables and an ordinal-level dependent variable in a meaningful order. This approach is utilized for comprehending and predicting the behavior of ordinal variables concerning independent ones.
It leverages generalized linear models to fit cutoff and coefficient vectors to the data set, making it a valuable tool for causal analysis and predictive modeling. It finds applications in various fields, including healthcare, psychology, and marketing, where it aids in predicting outcomes influenced by factors like patient response to treatments, student performance, and customer satisfaction.
Key Takeaways
- Ordinal regression is a statistical technique for modeling the relationship between one or more independent variables and an ordinal-level dependent variable, with the goal of understanding and predicting the behavior of the ordinal variable.
- It assumes ordinal dependent variables, independent variables of any type, no multicollinearity, and proportional odds.
- It manages ordered outcomes but assumes linearity, which may not be accurate.
- It forecasts ordinal dependent variables, whereas logistic regression predicts binary dependent variables, highlighting the contrast in their applications.
Ordinal Regression Method Explained
The ordinal regression model is a statistical method used to predict the behavior of an ordinal dependent variable while considering a set of independent variables. An ordinal variable consists of distinct categories with a meaningful order, although the intervals between these categories are not necessarily uniform. It places ordinal regression between classification and conventional regression methods, making it particularly suitable for analyzing ordinal-level dependent variables.
Ordinal regression employs a generalized linear model (GLM) to estimate thresholds and coefficients for the dataset. When applied to a set of observations, it models the relationship between an ordinal dependent variable and one or more independent variables by fitting a coefficient vector and a set of thresholds. This technique uncovers the relationship between independent variables and the dependent variable by forecasting the probability of falling into a specific category of the dependent variable.
In the realm of ordinal data analysis, tools like ordinal regression in SPSS and interpreting ordinal regression results in SPSS, ordinal regression in R, and ordinal regression Python are valuable resources for researchers and data analysts. It assumes that as independent variables increase, the probability of a higher category occurring also increases. This concept is known as the cumulative logit model. Its applications span causal analysis, trend prediction, and forecasting effects. For instance, it assists in credit analysis, where various credit rating agencies evaluate a business's creditworthiness on an ordinal scale.
It is also instrumental in customer preference analysis within the art market, determining socioeconomic factors affecting households and investigating the factors influencing risk tolerance among investors. It is used for predicting outcomes related to voter turnout, student performance, employee engagement, and patient responses to treatment. Banks rely on it to assess the likelihood of a customer defaulting on a loan, considering their credit score and debt-to-income ratio.
Assumptions
Before conducting an analysis, it is essential to consider several key assumptions. These assumptions are fundamental to the methodology and should be well understood:
- The dependent variable should be assessed using an ordinal scale, where categories exhibit a meaningful order but lack fixed intervals.
- Independent variables can encompass a range of types, including continuous, categorical, or ordinal variables, depending on the research context.
- It is essential to ensure that there is no multicollinearity among the independent variables. Multicollinearity refers to a high degree of correlation between independent variables, which can affect the model's stability and interpretability.
- This method relies on the proportional odds assumption. It means that each pair of outcome groups shares the same association with the independent variables. In practical terms, the coefficients describing the relationship between the lowest category of the dependent variable and all higher categories should be identical to those describing the relationship between the next lowest category and all higher categories, and so on.
Examples
Let us use a few examples to understand the topic.
Example #1
The study, published on August 16, 2020, aims to investigate how individuals sustained their optimism throughout the COVID-19 pandemic. The research delved into the connections between various positive factors, including physical, mental, and social well-being, preventive actions, and leisure activities. These factors were assessed on a 5-point Likert scale.
The results of the study revealed significant associations between people's positive responses during the lockdown and their income levels, participation in online book clubs/quizzes, and staying informed through newspapers, mobile apps, television, or the internet. This research underscores the importance of maintaining optimism during challenging times like a pandemic and highlights the influence of personal choices in nurturing a positive outlook.
Example #2
In a hypothetical scenario, ordinal regression was used by Jane, a marketing analyst at Fictional Insights Inc. in Rivertown, a busy metropolis, to gauge client happiness during her work there. She studied information gathered from a hypothetical chain of coffee shops named Brewville that was present in several places. Jane assessed customer satisfaction using a 5-point Likert scale and determined that a number of variables, including service caliber, coffee flavor, atmosphere, and cost, had an impact. By using this method, she discovered that while price and coffee flavor had less of an influence, service quality had a considerably favorable impact on customer satisfaction.
Thanks to this realization, Brewville was able to concentrate on raising customer pleasure, enriching the whole customer experience, and improving service quality, which eventually resulted in a rise in customer loyalty and company success in Rivertown and beyond.
Advantages And Disadvantages
Advantages
- Manages ordered outcomes
- Fewer parameters compared to other multiclass regression models
- Has Interpretable coefficients
- It has coefficients that are really understandable and clarify the connection between the characteristics and the result variable
- Suitable for trend forecasting, causal analysis, and effect forecasting
- Strong analytical tool for data including a number of independent variables and an ordinal dependent variable
- Numerous uses across a range of industries, including finance
Disadvantages
- Makes a significant assumption that could not be true in every situation
- Prone to lots of the same mistakes that other models of regression make
- Information loss during ordering
- Sometimes, estimates could be more realistic
- Using the wrong models can lead to more severe issues than those that these techniques were intended to address.
- Reduced statistical power
- Frequently, responses are so limited in scope relative to the topic that they introduce or amplify bias not taken into account in the survey
Ordinal Regression vs Logistic Regression
| Basis | Ordinal Regression | Logistic Regression |
|---|---|---|
| 1. Purpose | Forecasting ordinal dependent variables | Forecasting binary dependent variables
|
| 2. Management of Results | Handles ordered outcomes
| Handles unordered outcomes |
| 3. Number of Parameters | Fewer parameters compared to other multiclass regression models | More variables compared to ordinal regression |
| 4. Assumption on Result Groups | Assumes that every pair of result groups has the same connection with one another | Assumes a linear connection between predictor and result
|
| 5. Information Loss during Ordering | Some information was lost during the ordering process | No information loss throughout the ordering process |
| 6. Realism of Estimates | Sometimes, estimates may not be realistic | Less likely for estimates to be unrealistic |
| 7. Statistical Power | Reduced statistical power | Statistical power remains unaffected |
Frequently Asked Questions (FAQs)
1
When to use ordinal regression?
2
How to interpret ordinal regression in SPSS?
3
How to report ordinal regression results?
4
