Table Of Contents
What Is Ordinal Data?
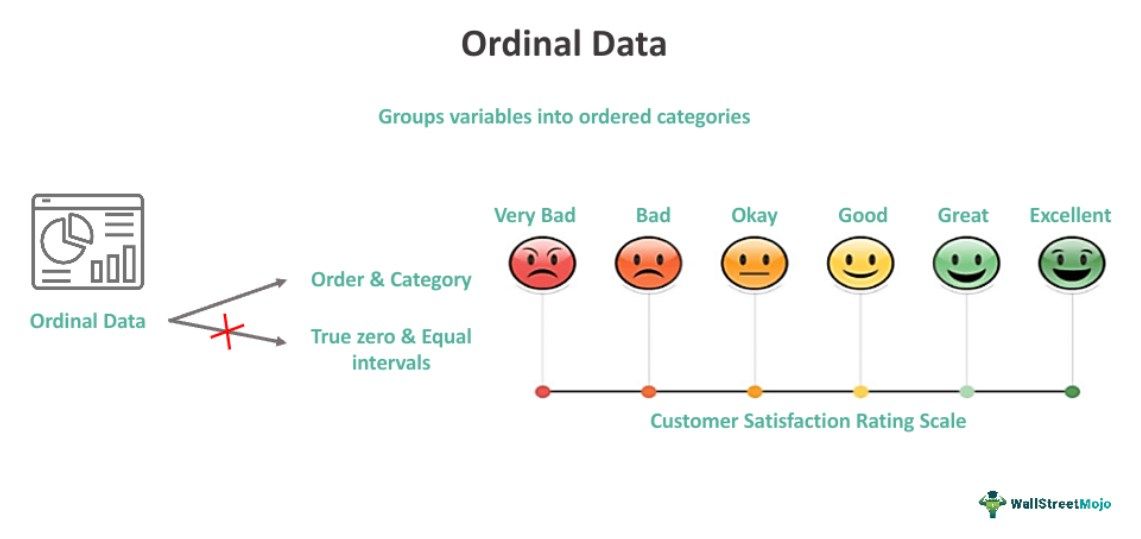
Ordinal data represents non-numeric categories or variables organized in their inherent rank order, though the disparities between successive variables might be uneven and unmeasurable. While these variables exhibit a connection, their distribution is often uneven.
Analysts and researchers utilize ordinal data in various fields, such as finance, insurance, marketing, business, governance, medical science, social science, education, and statistics. This qualitative data can be effectively analyzed through non-parametric tests and visualization tools like tables, charts, and plots, making it valuable for surveys, questionnaires, and demographic and psychographic analyses.
Key Takeaways
- Ordinal data is the qualitative and categorical data types where the variables or categories have a natural order or ranking.
- Although the variables in such a data series are distributed unevenly, the interval between them cannot be truly measured.
- Such data is interpreted through descriptive statistics - frequency distribution, central tendency measure and visualization tools;
- and inferential statistics - The Mann-Whitney U Test, Wilcoxon Signed-Rank Test, The Kruskal-Wallis H Test, Mood's Median Test and Spearman's Rank Correlation Coefficient.
- The concept is applicable in rating systems, surveys, questionnaires, market research, medical science research, education assessment, etc.
Ordinal Data Explained
Ordinal data is categorical information representing variables with a natural rank order, but the intervals between them are not consistently quantifiable. In other words, ordinal data entails arranging values in a specific order or sequence. However, the difference or interval between these categories or variables may not be uniformly equal or quantifiable in a meaningful manner. Consequently, ordinal data exhibits several distinctive characteristics, including:
- Categorical or non-numeric form of data (however, labels can be numbered),
- Qualitative rather than quantitative,
- Arranged in hierarchy, I.e., either in ascending or descending order,
- Uneven distribution where the interval values are unknown,
- Variables or categories are related and form a related order,
- Evaluate summary statistics, i.e., frequency distribution, range of variables, mode and median,
- Add-on to nominal data,
- Has a median and not an average, and
- No absolute zero.
One of the most common uses of ordinal data is the quality survey conducted by an e-commerce company for their customer care department. After every customer care call, the company sends an e-mail to the customer asking them to rate their experience of talking with the customer care executive on a scale of 1 to 10. The customer must answer a set of questions according to their satisfaction level. In this example, the interpretation of the difference between 1 and 2 ratings differs from that of the 9 and 10. Where the prior one shows immense dissatisfaction, the latter indicates maximum satisfaction.
How To Analyze?
When analyzing ordinal data, one can use both descriptive and inferential statistics:
1. Descriptive Statistics
- Frequency Distribution: Summarize the data using a frequency table.
- Visualization Tools: Represent the data with charts and bar graphs.
- Central Tendency Measures: Calculate the mode and median to understand the data's central values.
2. Inferential Statistics
- Mann-Whitney U Test: Compare central tendencies (e.g., medians) between two groups or samples.
- Wilcoxon Signed-Rank Test: Compare matched or paired samples.
- Kruskal-Wallis H Test: Assess significant differences between multiple independent groups.
- Mood's Median Test: Compare and test the equality of medians for two independent groups.
- Spearman's Rank Correlation Coefficient: Evaluate the strength and direction of the relationship between two sets of ordinal data or ranked variables.
These statistical tools help researchers and analysts draw meaningful conclusions from ordinal data without requiring certain assumptions necessary for parametric tests.
Examples
Some of the most common examples of ordinal data are:
- Educational assessments: Grading system in schools for annual assessment, i.e., A++, A+, A, B+, B, C. Also, education level, i.e., elementary, high school, graduate, post-graduate, doctorate.
- Health and medical research: Survey on stress levels like feeling very happy, happy, normal, sad or very sad.
- Market research: Consumer's response form after purchasing a product, including categories like highly satisfied, satisfied, dissatisfied or highly dissatisfied.
Advantages And Disadvantages
There are several advantages of using ordinal data, as discussed below:
- Facilitates comparative analysis: It helps compare two or more dependent or independent groups or samples using various non-parametric tests.
- Easy to collect: The data gathering is easy and orderly through ranking, rating or other categorical scales.
- Inferential analysis: It uses multiple non-parametric tests to determine the possible conclusions of the research.
- Dynamic: It has a broad application in psychology, education, social sciences, medical science, business, marketing and various other fields to measure attitudes, beliefs, and behaviors.
- Better than nominal data: Since it facilitates analyzing the correlated variables or categories, it is superior to the nominal data that labels data into unrelated categories.
- Less affected by outliers: Such data is less influenced by the variables that fall outside the average value of the respective sample.
- Has a median value: The ordinal data always provide a middle value.
- Qualitative analysis: It is most suitable when the data is challenging to measure or cannot be quantified reasonably.
However, ordinal data has several limitations:
- Not quantitative: Since it focuses on the qualitative aspect, it only indicates the relative order of values, while the quantitative factor is overlooked in such a form of data.
- Interval values are unknown: The differences between the variables are unequal and not measurable.
- Limited application: Some statistical inferences may not be appropriate for ordinal data, as they require assumptions about the data distribution or numerical values.
- Misrepresentation: When the original data is simplified while converting the continuous data into ordinal data, the different values are considered the same and compiled in a single category.
- The ranking is subjective: The ranking of ordinal data is subjective, which can lead to inconsistencies in data collection and affect the reliability of the results.
- Fails to determine average value: It is impossible to determine such data's average values like mean and variance.
Ordinal Data vs Nominal Data vs Interval Data
Different kinds of measurement scales are available for statistical analysis, including the ordinal, nominal and interval scales. Although all three - ordinal, nominal and interval data categorize the variables and determine the mode, they don't have an absolute zero value. Now let us gauge the major differences between these three kinds of data:
| Basis | Ordinal Data | Nominal Data | Interval Data |
|---|---|---|---|
| Meaning | Qualitative data comprises variables arranged in their natural order or ranking, but the interval values among them are unequal or unknown. | Non-numeric data where the variables are segregated into mutually exclusive categories which have no meaningful order or arrangement | Quantitative data wherein the variables are arranged in sequential order at equal distances along an integer scale |
| Type | Categorical or qualitative | Categorical or qualitative | Numerical or quantitative |
| Rank Order | Natural order or ranking | No natural order or ranking | Ranked in order |
| Meaningful Order and Correlation Between Variables | Yes | No | Yes |
| Interval Values and Differences Between Variables | Unequal and unknown | Unequal and unknown | Equal and known |
| Statistical Analysis | Descriptive and inferential statistics by using non-parametric tests and visualization tools | Descriptive statistics by a category-wise grouping of variables and determining the frequency distribution and central tendency | Descriptive and inferential statistics by using parametric tests and visualization tools |
| Simplicity | Comparatively complex | Basic or simple | Most complex |
| Comparability of Ranks | Possible | Impossible | Impossible |
| Examples | Rating system, surveys, questionnaires | Nationalities, Animal species, blood groups | IQ test, credit scores, temperature |
