Table Of Contents
What Is Order Flow Trading?
Order Flow Trading refers to the analysis that traders and investors make in the stock market, primarily by using the order book. The study gives idea about the type of trade, direction of trade and the impact of the stock movement on price.

Typically, short-term traders use this method to collect real-time data and find out the exact time to enter and exit the market. Most traders commonly use technical indicators, but experts may use these technical indicators along with the order flow strategy. The flow and type of orders give an obvious idea about market direction and help in making trading decisions.
Table of contents
- What Is Order Flow Trading?
- Order flow trading refers to real-time data analysis collected from trading platforms related to a particular stock or security.
- It gives details like trade direction, price movement, and volume, whose combination gives a complete picture of the security momentum and trend.
- Short-term professional trades use it in combination with other indicators to make trade decisions.
- It gives a more detailed view of all orders, both limit and market, as compared to candlesticks, in the form of price movements or support and resistance.
Order Flow Trading Strategy Explained
Order flow trading explains how traders use the data related to the order flow obtained from a trading platform to analyze the movement of stocks and make trade-related decisions. The order flow is a list of buy and sell orders that will be executed. The list is an electronic record that is maintained by the stock exchange, in the form of order book.
The arrangement of the orders in the order flow trading strategy is as per the priority of price or time. So the highest priced orders will come first on top of the list in case of buy orders, and the price decreases towards the bottom. The opposite happens in the case of sell orders, where the list is arranged with the lowest price on top and goes on increasing towards the bottom. Every order has the corresponding time mentioned.
The study and analysis give traders an idea about the volume of trade, the influence of the buyers and the sellers who are in control of the market, the level that has the largest volume, and the entire list of limit orders. It gives a deeper or more detailed view of the process as compared to candlesticks. The candles show the orders that are accumulated and pending execution. But the order flow chart shows every order, thus providing the view at the micro level with the details of both market and limit orders.
This data and order flow trading platform is also a source of identifying the possible support and resistance levels through the analysis of volume distribution over price during a particular range of time. However, along with the order book, the footprint chart, which is a kind of candlestick chart, also provides details of the order flow.
Thus, this strategy is beneficial for getting lots of additional information for trading analysis and has become quite a popular tool for providers of trading platforms and charts, facilitating technical analysis.
How To Trade?
This order flow trading strategy is a great tool for professional traders, especially those who trade for the short term. It provides more, and in-depth information, beyond the candlesticks enabling traders gets a better grip of the demand and supply imbalances of the market. Learning to read this data will help traders identify such imbalances skillfully, using the bid and ask price.
The study of order flow reveals when to enter a profitable trade and what the corresponding price levels should be. It gives the trader a considerable list of information, like the orders that are heavy enough to turn the market, the buying and selling momentum, etc.
For the order flow trading setups, the Footprint Chart is commonly used, along with the price. It provides multidimensional diagrams and gives additional information. The chart can be customized as per the trader’s requirement, including the time frame. It can be used in combination with charts like Level 2 or Depth of Market (DOM).
The above can be used to compare the current market condition with the orders yet to be executed. Thus, the order flow helps the trader to react depending on the market action. The volumes of bid and ask trading can be compared to check the control levels of bulls and bears.
Indicators
This technique order flow trading setups gives details about some important components of trading, which are the time, price, and volume, it is logical to consider all of them. Considering only any or two factors will not show the entire picture clearly because they are all interlinked.
The most efficient indicator of order flow will show how the movement of price during a particular time range and volume will change or affect the momentum. Some common indicators are:
- Footprint chart – This may be of different types like the bid-ask chart or volume delta chart. The former displays all traded orders at various bid and ask levels and the latter measures that gap in buying and selling momentum.
- Volume profile – This tool helps traders identify price movement and show herd behavior. The support and resistance levels are known from here because the volume profile reveals the trading volume dispersion over the price.
- Time and Sales – This is real-time data of time, price, and volume. It is the digital version of the ticker tape. It is used to get data on high-volume trades that can alter the market condition.
- Depth of Market (DOM) or Level 2 – The limit buy and sell orders are displayed in the order book and the liquidity levels can be analyzed. It is easy to identify who is in control, the bulls or bears.
- Volume-Weighted Average Price (VWAP) – In this, based on the volume, the average price is taken. This helps determine the correct buy and sell price for trading.
- Money Flow Index (MFI)- It is a momentum indicator to measure the money flow in and out of the security, at a particular combination of price, volume, and time. It is similar to RSI, oscillating between 0 to 100. It depicts the oversold and overbought market scenario.
Chart
This trading process is best for stock markets that have a central exchange. Let's look at a chart from TradingView showing the order book of Meta on NASDAQ to understand the concept better:
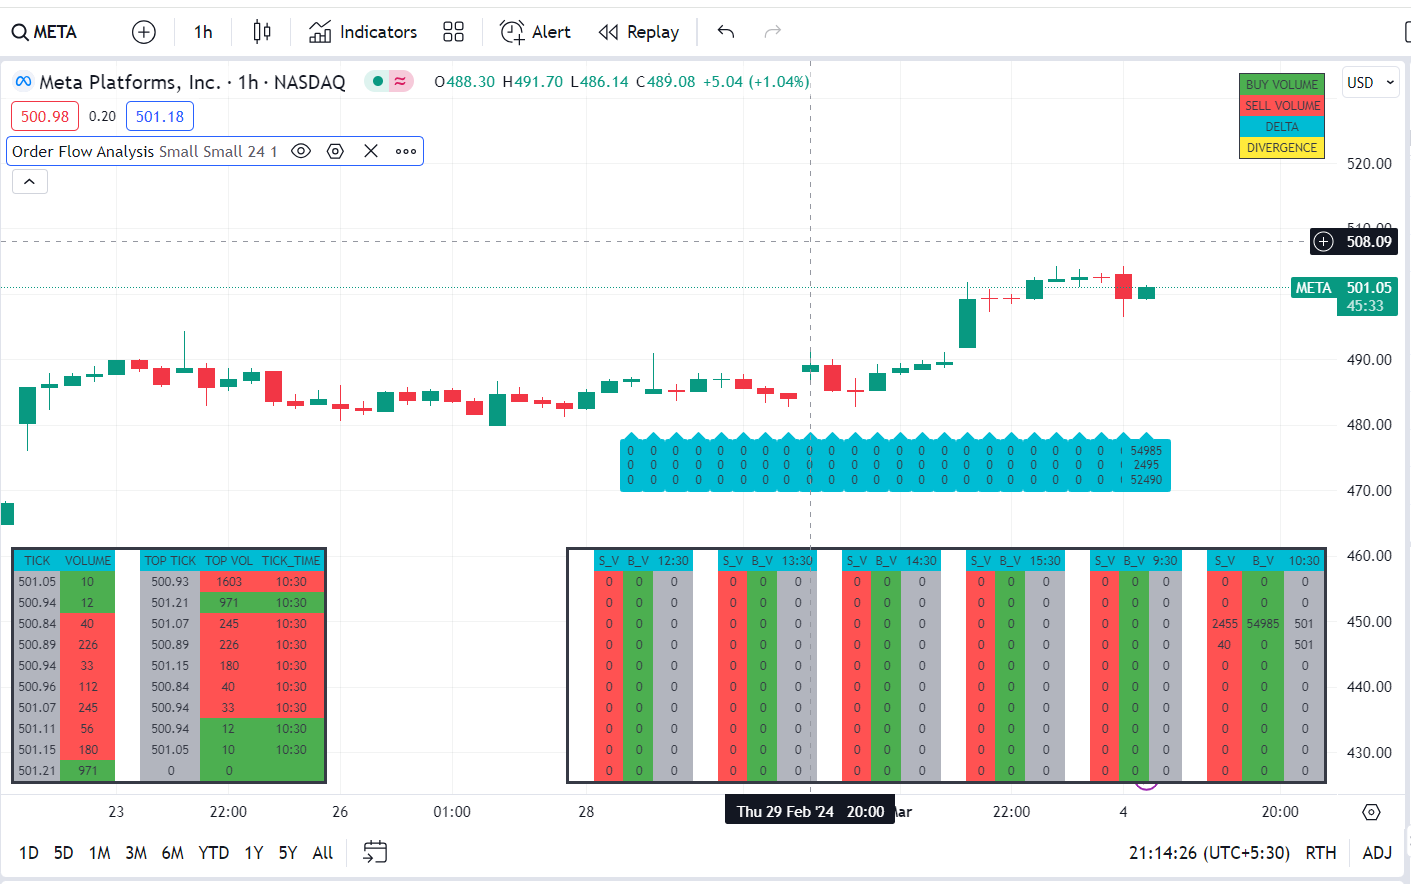
In the above screenshot, we can see how the data is displayed. It is the order flow of Meta in an hourly chart on 4th March 2024. We can see what kind of orders are placed at a particular time of the market. As already mentioned in the index on the top right corner, the display in green is the buy volume, and red is the sell volume. In the box on the left, there is a column showing the time.
Examples
Let us understand the concept of order flow trading software with the help of some suitable examples, as given below:
Example #1
Let us take a situation where the trader Alex is paling to trade on stock XYX Ltd and can see a lot of volatility on hourly price movements. However, since he is a short-term trader, he is eager to take up the difference in the price fluctuations to make profits. He gets the order flow data of the stock and analysis shows that there is much sell orders at the support level, which is more that the buy orders. Therefore, the bears are overpowering the bulls at the support, proving that there is a strong possibility of a downtrend from that point. He decides to go short on the stock and finally makes a profit by buying at a lower price.
Example #2
A brokerage firm receives a fraction of the share price as compensation for directing trade orders for execution to the exchange, which is known as payment for order flow trading. According to the CEO of the trading firm Robinhood, this payment system is not under any threat of being stopped permanently because it is totally legal in the US. It is totally normal to make money out of a business that encourages transactions of any kind. Therefore, the CEO, Vlad Tenev, strongly feels that there will be no change.
Benefits
This concept of order flow trading platform has many benefits, as given below:
- Identify market sentiments – It is possible to identify the direction, volume and overall trend of the market from this process, which gives a idea about the intention of market participants. It is more than just fundamental analysis and helps in tracking trends and reversals.
- Price anticipation – The price movement and any change in the trend of price can be identified, along with the strength and weakness. If suddenly there is a huge selling taking place at the resistance level, then there is every possibility of a down move.
- In-depth details – The concept provides more details that may not be acquired from any other analysis. This may include irregular market patterns, activity of institutional investors, or any repetition in price patterns. This helps in making trade decisions.
- Comprehensive understanding – This gives a wholesome understanding of price movements and market dynamics, which controls flawed decisions while trading. In this way, traders can align their decisions with large institutional investors.
For professional-grade stock and crypto charts, we recommend TradingView – one of the most trusted platforms among traders.
Disclosure: This article contains affiliate links. If you sign up through these links, we may earn a small commission at no extra cost to you.

Frequently Asked Questions (FAQs)
There are a number of software in the market that can be used for analysis of order flow and trading in securities. However, the most common ones are MotiveWare, Ninja Trader, Sierra Charts, Advanced Trading Analytics Software (ATAS), and Exo Charts. However, all charting platforms may not come with all types of advanced tools, which can be acquired from third parties with extra payment.
This method may prove to be complex or confusing for beginners. But with practice and study, it is possible to learn it and use it properly to take important trade related decisions.
The concept of swing trading explains the process of capturing profits from price fluctuations within a range of a few days to weeks. Thus it is a short term concept, that mainly use technical indicators. Therefore, this concept is useful in swing trading because it is a part of technical analysis that use volume, price and time to find momentum, support and resistance.
Recommended Articles
This article has been a guide to what is Order Flow Trading. Here, we explain the concept along with how to trade it, its indicators, chart, examples, and benefits. You may also find some useful articles here –
